Vehicle Manufacturers - EART 2025-1 - Top 10
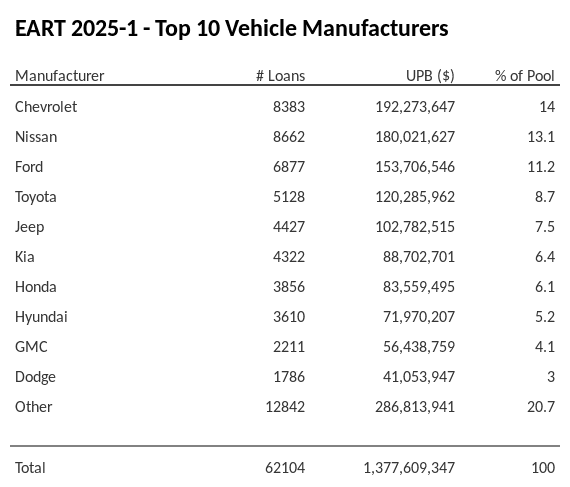
The top 10 vehicle manufacturers in the collateral pool for EART 2025-1. EART 2025-1 has 14% of its pool in Chevrolet automobiles.
Chart Summary
EART 2025-1 has 14% of its pool comprised of loans for Chevrolet automobiles, totaling $192,273,647 in unpaid principle balance according to Edgar sec.gov filings. The reporting period for this information begins 2024-12-01 and ends 2024-12-31.
Prompts
Explore a variety of thoughtfully crafted prompts below, each tailored for specific use cases. Each card includes a convenient copy-paste button that lets you seamlessly transfer the prompt into your favorite AI tool. Whether you're using ChatGPT, Google Bard, or Claude, these prompts are designed to help you unlock new insights and ideas. Simply click 'Copy' to get started!
Summarize Manufacturer Distribution
Summarize the top 10 vehicle manufacturers chart for EART 2025-1. Highlight the top 10 manufacturers contributing to the pool, their number of loans, UPB, and percentage of the pool. Discuss how the distribution is split across the top brands and the "Other" category.
Highlight Manufacturer Concentration Risk
Analyze the top 10 vehicle manufacturers chart for EART 2025-1 to identify any concentration risks. Focus on manufacturers contributing more than 10% of the pool, and discuss how this impacts deal diversification and exposure to specific brands.
Compare to Market Averages by Manufacturer
Compare the top 10 vehicle manufacturers chart for EART 2025-1 to historical manufacturer averages for ABS auto deals. Highlight manufacturers with unusually high or low representation and discuss what this might suggest about underwriting or borrower demographics.
Visualize Manufacturer Distribution (Bar Chart)
Create a bar chart for the top 10 vehicle manufacturers chart of EART 2025-1, showing the UPB for the top 10 manufacturers and the "Other" category. Use distinct colors to highlight the top 3 manufacturers and annotate the chart with their pool percentages.
Impact of 'Other' Loans on Diversification
Evaluate the impact of the "Other" category in the top 10 vehicle manufacturers chart for EART 2025-1. Discuss whether the large share of "Other" loans (29.2% of the pool) introduces additional diversification or obscures risks from smaller, less-represented brands.
Benchmark Against Historical Manufacturer Trends
Compare the top 10 vehicle manufacturers chart for EART 2025-1 to historical trends in manufacturer presence within ABS auto deals. Highlight whether representation from brands like Nissan, Dodge, or Chevrolet has increased or decreased over time, and discuss potential reasons.
Analyze Mid-Tier Manufacturer Performance
Focus on the mid-tier manufacturers in the top 10 vehicle manufacturers chart for EART 2025-1 (e.g., Kia, Chevrolet Truck, Dodge). Discuss their contributions to diversification and their potential influence on pool stability compared to dominant or "Other" brands.
Evaluate Geographic Correlation with Manufacturers
Assume regional data is available. Analyze how loans for each manufacturer in the top 10 vehicle manufacturers chart for EART 2025-1 are distributed geographically. Discuss whether certain brands are overexposed to regions with economic volatility or growth potential.
Assess Risks from Economic Trends
Using the top 10 vehicle manufacturers chart for EART 2025-1, assess how economic trends (e.g., rising interest rates, inflation, or supply chain challenges) might impact the performance of loans tied to the top 10 manufacturers.
Forecast Manufacturer Trends in Future Pools
Project how representation from the top 10 manufacturers in the top 10 vehicle manufacturers chart for EART 2025-1 might change in future ABS auto pools. Discuss factors like electric vehicle (EV) adoption, brand-specific market share trends, and borrower preferences.
Risk Assessment for Underrepresented Manufacturers
Focus on manufacturers in the lower tier of the top 10 vehicle manufacturers chart for EART 2025-1 (e.g., Hyundai, Ford Truck). Discuss whether their smaller pool contributions mitigate risk or reflect borrower or collateral quality issues.
Create a Pie Chart for Manufacturer Distribution
Transform the top 10 vehicle manufacturers chart for EART 2025-1 into a pie chart to show the percentage of the pool for the top 10 manufacturers and "Other" loans. Highlight the distribution and discuss its implications for diversification and risk.
Compare Manufacturer Composition Across Peer Deals
Benchmark the top 10 vehicle manufacturers chart for EART 2025-1 against peer ABS auto deals issued in the same year. Discuss differences in manufacturer representation and what they might suggest about underwriting, borrower demographics, or deal strategies.
Analyze Manufacturer Dominance
Evaluate whether the top 10 vehicle manufacturers chart for EART 2025-1 reflects dominance by a few key manufacturers or a balanced distribution. Discuss how this balance (or imbalance) impacts the overall pool risk and investor confidence.
Other Links
Get the data

Dataset used to create this chart
Exact curated dataset used to create this chart and other charts on this site.

