Vehicle Manufacturers - EART 2025-1 - Top 5
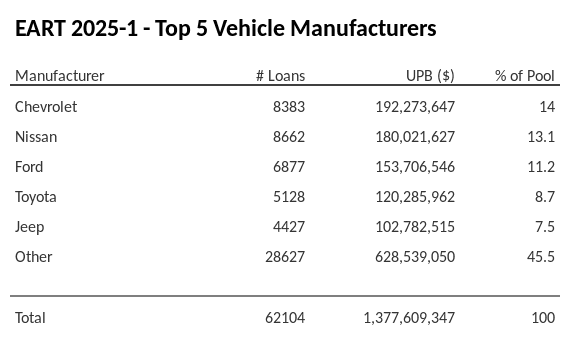
The top 5 vehicle manufacturers in the collateral pool for EART 2025-1. EART 2025-1 has 14% of its pool in Chevrolet automobiles.
Chart Summary
EART 2025-1 has 14% of its pool comprised of loans for Chevrolet automobiles, totaling $192,273,647 in unpaid principle balance according to Edgar sec.gov filings. The reporting period for this information begins 2024-12-01 and ends 2024-12-31.
Prompts
Explore a variety of thoughtfully crafted prompts below, each tailored for specific use cases. Each card includes a convenient copy-paste button that lets you seamlessly transfer the prompt into your favorite AI tool. Whether you're using ChatGPT, Google Bard, or Claude, these prompts are designed to help you unlock new insights and ideas. Simply click 'Copy' to get started!
Summarize Manufacturer Distribution
Summarize the top 5 vehicle manufacturers chart for EART 2025-1. Highlight the top 5 manufacturers contributing to the pool, their number of loans, UPB, and percentage of the pool. Discuss the implications of the "Other" category making up more than 50% of the pool.
Highlight Manufacturer Concentration Risk
Analyze the top 5 vehicle manufacturers chart for EART 2025-1 to identify any concentration risks. Focus on manufacturers contributing more than 10% of the pool and discuss how their performance might affect the deal's overall risk profile.
Compare to Market Averages by Manufacturer
Compare the top 5 vehicle manufacturers chart for EART 2025-1 to industry averages for ABS auto deals. Highlight any manufacturers that are overrepresented or underrepresented in the pool and discuss potential reasons for these differences.
Visualize Manufacturer Distribution (Bar Chart)
Create a bar chart visualization for the top 5 vehicle manufacturers chart of EART 2025-1, showing the UPB for each manufacturer. Highlight the top manufacturer with a distinct color and annotate the chart with their percentage of the pool.
Impact of 'Other' Loans on Diversification
Evaluate the impact of the "Other" category in the top 5 vehicle manufacturers chart for EART 2025-1. Discuss whether a large "Other" category suggests higher diversification or if it might obscure risks associated with smaller, less-known manufacturers.
Benchmark Against Historical Manufacturer Trends
Compare the top 5 vehicle manufacturers chart for EART 2025-1 to historical trends in top manufacturers within ABS auto deals. Highlight whether the presence of specific brands like Nissan, Dodge, or Jeep has increased or decreased over time, and discuss what this suggests about market conditions.
Risk Assessment for Underperforming Brands
Identify any potential risks associated with the manufacturers in the top 5 vehicle manufacturers chart for EART 2025-1. Focus on brands with declining market shares or known operational challenges and discuss how this might impact pool performance.
Evaluate Geographic Correlation with Manufacturers
Assume regional data is available. Analyze the geographic concentration of loans associated with each manufacturer in the top 5 vehicle manufacturers chart for EART 2025-1. Discuss whether regional economic conditions might disproportionately affect certain brands.
Assess Performance During Economic Downturns
Using the top 5 vehicle manufacturers chart for EART 2025-1, evaluate how loans tied to the top 5 manufacturers might perform during an economic downturn. Discuss whether brands with larger market shares are more resilient or exposed to default risk.
Forecast Manufacturer Trends in the Pool
Using the top 5 vehicle manufacturers chart for EART 2025-1, project the share of top manufacturers over the next few years. Discuss whether certain brands might grow or shrink their representation in future ABS auto pools based on current market trends.
Analyze Long-Tail Risk in 'Other' Manufacturers
Focus on the "Other" category in the top 5 vehicle manufacturers chart for EART 2025-1 and analyze the potential risks associated with smaller or niche manufacturers. Discuss whether this long tail of manufacturers introduces additional diversification or unknown risks.
Create a Pie Chart for Manufacturer Distribution
Transform the top 5 vehicle manufacturers chart for EART 2025-1 into a pie chart to show the percentage of the pool for each manufacturer. Highlight the top 5 brands and "Other" as distinct slices, and discuss the balance of the pool.
Compare Manufacturer Composition Across Peer Deals
Compare the top 5 vehicle manufacturers chart for EART 2025-1 to peer ABS auto deals issued in the same year. Highlight any notable differences in the presence or absence of major manufacturers and discuss what this suggests about underwriting or borrower demographics.
Assess the Impact of Electric Vehicle (EV) Trends
Discuss whether the top 5 vehicle manufacturers chart for EART 2025-1 reflects any impact of electric vehicle (EV) adoption trends. Highlight brands that are investing in EV production and discuss how this might influence the pool's performance and investor perceptions.
Other Links
Get the data

Dataset used to create this chart
Exact curated dataset used to create this chart and other charts on this site.

