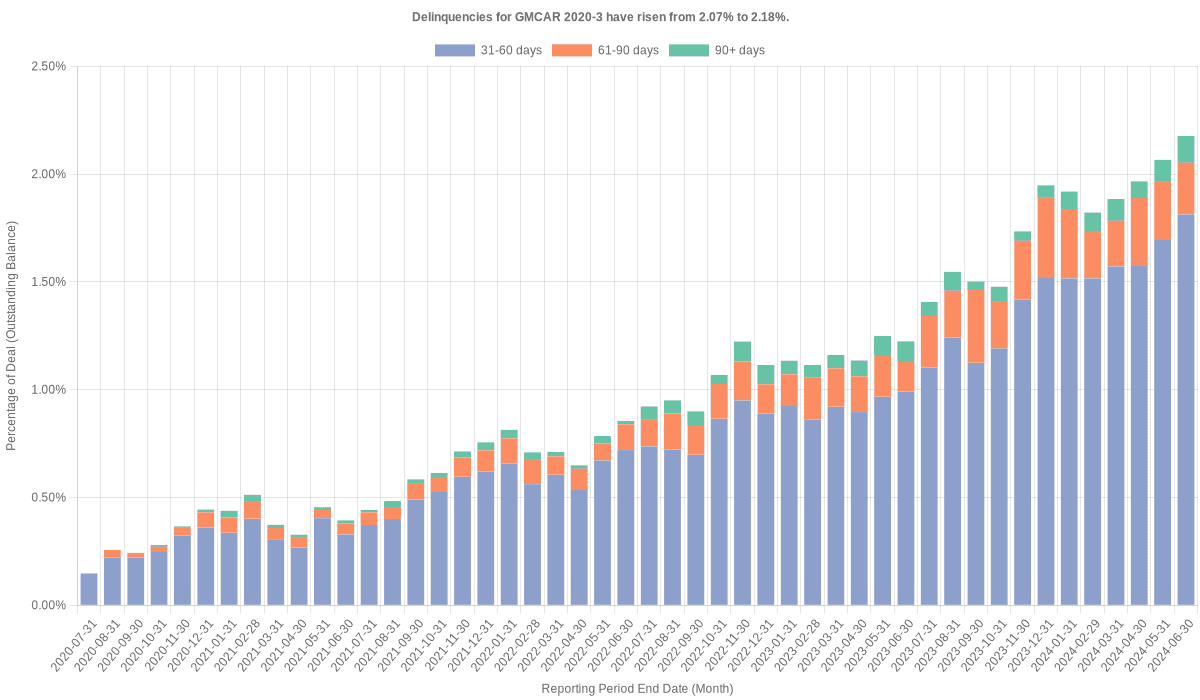
30/60/90 Day Delinquency Percentage - GMCAR 2020-3
Delinquencies for GMFC 2020-3 have risen from 2.07% to 2.18%.
Chart Summary
Delinquencies for GMFC 2020-3 have risen from 2.07% to 2.18%. according to Edgar sec.gov filings.
Prompts
Explore a variety of thoughtfully crafted prompts below, each tailored for specific use cases. Each card includes a convenient copy-paste button that lets you seamlessly transfer the prompt into your favorite AI tool. Whether you're using ChatGPT, Google Bard, or Claude, these prompts are designed to help you unlock new insights and ideas. Simply click 'Copy' to get started!
Summarize Delinquency Trends Over Time
Summarize the delinquencies chart for GMCAR 2020-3. Highlight key changes in delinquency rates over time for each category (31-60 days, 61-90 days, 90+ days). Discuss any significant increases or decreases and what they might indicate about the deal's performance and borrower behavior.
Identify Periods of Stress
Analyze the delinquencies chart for GMCAR 2020-3 to identify periods where delinquency rates spiked significantly. Discuss potential causes, such as economic downturns, seasonal patterns, or changes in servicing practices.
Compare Recent Performance to Historical Trends
Compare the most recent delinquency rates in delinquencies chart for GMCAR 2020-3 to the historical trends. Discuss whether the current rates are improving, stabilizing, or worsening relative to the deal's past performance.
Visualize Month-over-Month Delinquency Changes
Using the delinquencies chart for GMCAR 2020-3, calculate the month-over-month change in delinquency rates for each category. Create a line chart to highlight fluctuations and discuss the implications of these changes on cash flow and risk.
Project Future Delinquency Scenarios
Using the delinquencies chart for GMCAR 2020-3, project delinquency rates for the next 6-12 months based on historical trends. Discuss how these projections might impact investor returns, default risk, and servicing practices.
Compare to Peer Group Deals
Benchmark the delinquency trends in delinquencies chart for GMCAR 2020-3 against peer ABS auto deals issued in the same year. Highlight any deviations in the trajectory of delinquency rates and discuss possible reasons for these differences.
Assess Performance Across Delinquency Buckets
Analyze the delinquencies chart for GMCAR 2020-3 to evaluate the relative contribution of each delinquency bucket (31-60 days, 61-90 days, 90+ days) over time. Discuss which buckets are growing or shrinking and the potential implications for pool performance.
Examine the Impact of Economic Events
Overlay major economic events (e.g., interest rate hikes, unemployment changes, inflation) onto the delinquencies chart for GMCAR 2020-3. Discuss how these events may have influenced delinquency trends and their potential future impact.
Evaluate Recovery from Peak Delinquencies
Identify the peak delinquency period in the delinquencies chart for GMCAR 2020-3 and assess the recovery trend since that time. Discuss whether the pool appears to be stabilizing or facing ongoing challenges.
Risk Assessment Based on Delinquency Trends
Using the delinquencies chart for GMCAR 2020-3, assess the potential risks posed by rising delinquency rates. Focus on the implications for cash flow disruptions, increased servicing costs, and potential losses to investors.
Create a Stacked Area Chart for Delinquency Composition
Visualize the delinquencies chart for GMCAR 2020-3 as a stacked area chart to show how the composition of delinquencies (31-60 days, 61-90 days, 90+ days) has evolved over time. Highlight which categories are contributing most to the overall delinquency rate and provide insights into these shifts.
Forecast Delinquency Recovery Scenarios
Create multiple recovery scenarios for the delinquencies chart in GMCAR 2020-3. For example, project how long it might take for delinquency rates to return to pre-peak levels under optimistic, neutral, and pessimistic economic conditions. Discuss the implications for deal performance.
Assess Seasonality in Delinquency Trends
Analyze the delinquencies chart for GMCAR 2020-3 to identify any seasonal patterns in delinquency rates. Discuss how these patterns might impact cash flow timing and investor expectations.
Analyze Transition Between Delinquency Buckets
Using the delinquencies chart for GMCAR 2020-3, analyze how loans transition between delinquency buckets (e.g., from 31-60 days to 61-90 days). Discuss how these transitions affect overall delinquency rates and what they reveal about borrower repayment behavior.
Other Links
Get the data

Dataset used to create this chart
Exact curated dataset used to create this chart and other charts on this site.

