Marketplace dataset
All States — Geographic Distribution: BMO 2024-5C7 | Dealcharts
BMO 2024-5C7 has 34.1% of its pool located in the state of New York. Free CMBS chart for BMO 2024-5C7. Updated from SEC EDGAR filings.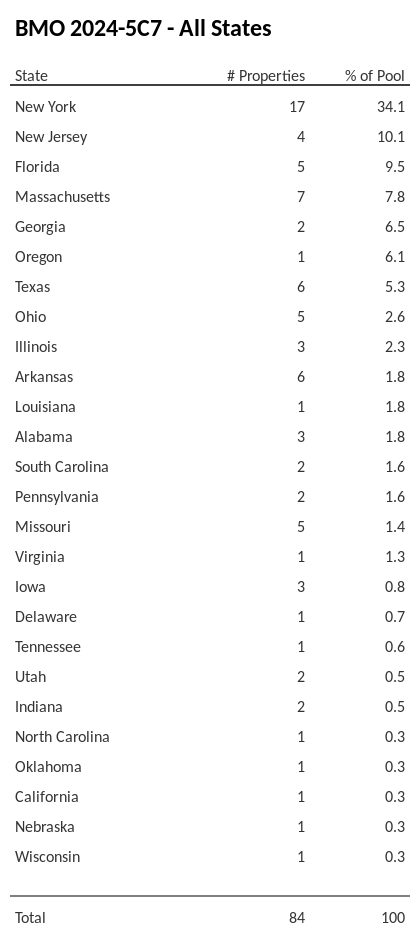
📊 Chart Summary
BMO 2024-5C7 has 34.1% of its pool located in the state of New York according to Edgar sec.gov filings. The reporting period for this information begins 2026-05-12 and ends 2026-06-11.
Ask Cairn
What does BMO 2024-5C7 mean for you?
Tell Cairn where you sit — a CUSIP you hold, or a seat you're sizing up. Cairn does the digging and tailors the answer to your position, every figure tied to the filing it came from.01Tell Cairn the deal and your seat
02Cairn does the digging
03You get the read for your seat, by email
Get the data
Marketplace dataset
XML datasets for CMBS deals
Raw XML filings from sec.gov that include this data and more for in-depth analysis.
Paid
Marketplace dataset
CREFC IRP standardized datasets
Get the standardized dataset following the CREFC IRP format, ideal for advanced reporting and analysis.
Paid