Why and How We Made the ABS Delinquencies Chart
Discover how we created the ABS delinquencies chart using a metadata-first data strategy. Learn about our process of collecting, curating, and operationalizing data to provide valuable insights into delinquency trends in ABS auto loan deals.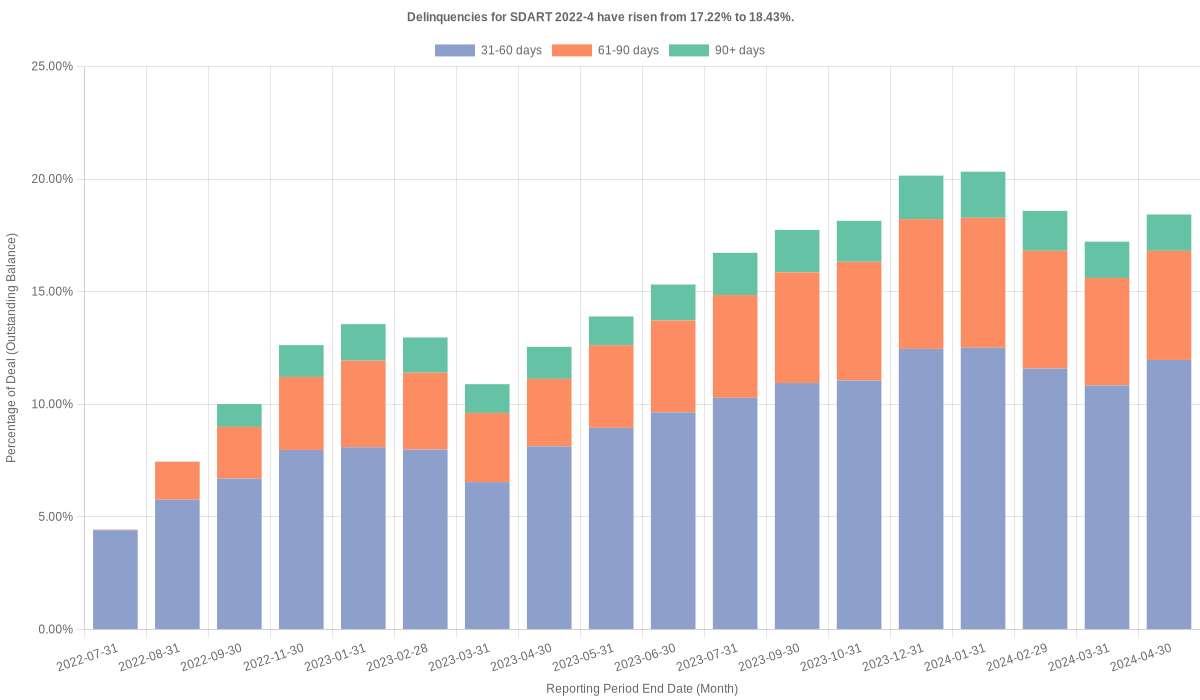
How We Made This Chart
Our ABS delinquencies chart is designed to help you track the trend of delinquencies in the collateral pool over time for ABS securitized deals. Here’s a detailed look at how we created this chart using our metadata-first data strategy:
Collecting Metadata
We started by collecting metadata from various sources, including the Reg AB II Asset-level Requirements. This involved gathering data schemas and identifying key data points like the Current Delinquency Status, Reporting Period Actual End Balance Amount, and Reporting Period Ending Date from Form ABS-EE for each deal.
The data for this chart comes from publicly available SEC filings, ensuring transparency and accessibility. The primary data points collected include delinquency status (31-60 days, 61-90 days, and 90+ days) and the reporting period end balance amount over different months.
Curating Metadata
After collecting the raw metadata, we curated it to focus on the most relevant information. This involved filtering the data to include only the necessary elements for visualizing delinquency trends over time. We organized the data by grouping delinquency statuses and calculating the percentage of the outstanding balance for each status category over time.
This process helped in highlighting trends and changes in delinquency rates across different periods.
For example, the chart shows how delinquencies for NAROT 2020-A have risen from 1.54% to 1.66% over time, broken down into different delinquency periods (31-60 days, 61-90 days, and 90+ days).
Operationalizing Metadata
Using our advanced data pipelines, we transformed the curated metadata into a visual format. This involved automating the process to generate hundreds of delinquency charts, one for each auto loan deal.
We utilized data visualization tools to create clear and intuitive charts. The chart you see above represents the delinquency trends, with different colors indicating various delinquency periods, providing a comprehensive view of the data.
The operationalization process ensures that the charts are not only accurate and up-to-date but also easy to interpret and use for analysis. This automation allows us to quickly produce similar charts for multiple deals, maintaining consistency and reliability.
If you want to visualize delinquencies differently or explore other metrics for ABS auto loan deals, feel free to email us.
You can also explore all available ABS Auto Loan deals with this chart.
Why This Chart Is Valuable
For a detailed explanation of the overall value and purpose of our charts, please refer to our introductory post here.
Specifically, this ABS delinquencies chart can be beneficial to:
-
Financial Analysts: Gain quick insights into delinquency trends to inform investment decisions and risk assessments.
-
Investment Managers: Use the charts to assess the performance and risks associated with ABS auto loan deals.
-
Credit Risk Managers: Monitor delinquencies and assess the quality of the underlying assets in ABS pools.
-
Regulatory Compliance Officers: Ensure compliance with regulatory requirements by verifying delinquency data.
-
Data Analysts: Save time by leveraging pre-made charts for initial analysis and validation of their own data visualizations.
-
Institutional Investors: Use these charts in presentations and reports to stakeholders, showcasing trends and performance metrics.
-
Research Analysts: Explore new datasets and visualization techniques to enhance their research and reports.
-
Consultants: Provide clients with quick and reliable insights by incorporating these charts into their analyses and recommendations.
Real-World Applications
To illustrate the practical applications of this chart, consider the following scenarios:
-
Investment Decision-Making: A financial analyst at an investment firm uses the delinquency chart to evaluate the risk profile of various ABS auto loan deals before making investment decisions.
-
Regulatory Reporting: A compliance officer at a bank uses the chart to ensure that the bank’s portfolio of ABS deals complies with regulatory standards, avoiding potential fines and penalties.
-
Market Research: A research analyst at a market research firm incorporates the delinquency chart into a comprehensive report on the auto loan market, providing clients with actionable insights.
By following a metadata-first data strategy—collecting, curating, and operationalizing metadata—we can quickly and efficiently produce valuable insights and visualizations. This approach allows us to autogenerate hundreds of delinquency charts, saving you time and providing reliable verification.
We hope this chart saves you time, inspires new insights, and provides reliable verification.