Commercial Real Estate Comps
How to Build Verifiable Commercial Real Estate Comps
In structured finance, commercial real estate comps are the bedrock of underwriting, risk modeling, and CMBS surveillance. Generic, opaque comparable property sets are no longer defensible. For analysts, data engineers, and quants, the critical challenge is building a verifiable data lineage—tracing every valuation input back to a citable source like a servicer report or an SEC filing. This guide moves past surface-level explanations to detail a programmatic, data-driven workflow for creating auditable comps. We'll cover data sourcing from public filings, programmatic analysis, and how platforms like Dealcharts provide the linked datasets needed to visualize and cite this analysis with confidence.
Why Comps Matter in CMBS and Credit Markets
In the context of CMBS and broader credit markets, commercial real estate comps are not merely a valuation exercise; they are a primary input for credit risk assessment. When underwriting a loan for a securitization pool, the property's value—backed by defensible comps—directly influences the loan-to-value (LTV) ratio, a key metric for investors. Post-securitization, ongoing surveillance of the underlying collateral relies on updated comps to monitor property performance and identify potential credit deterioration, especially in volatile markets where historical data is less reliable.
The technical challenge lies in the fragmented and unstructured nature of the source data. An analyst might need to triangulate information from a 10-K filing, a loan tape from a 424B5 prospectus, and monthly servicer remittance reports. This manual, error-prone process creates significant bottlenecks and limits the scalability of any analysis. As market dynamics shift, such as the bifurcation between the industrial and office sectors, the ability to programmatically refresh comp sets with verifiable data becomes a competitive advantage.
Sourcing and Linking Data for Commercial Real Estate Comps
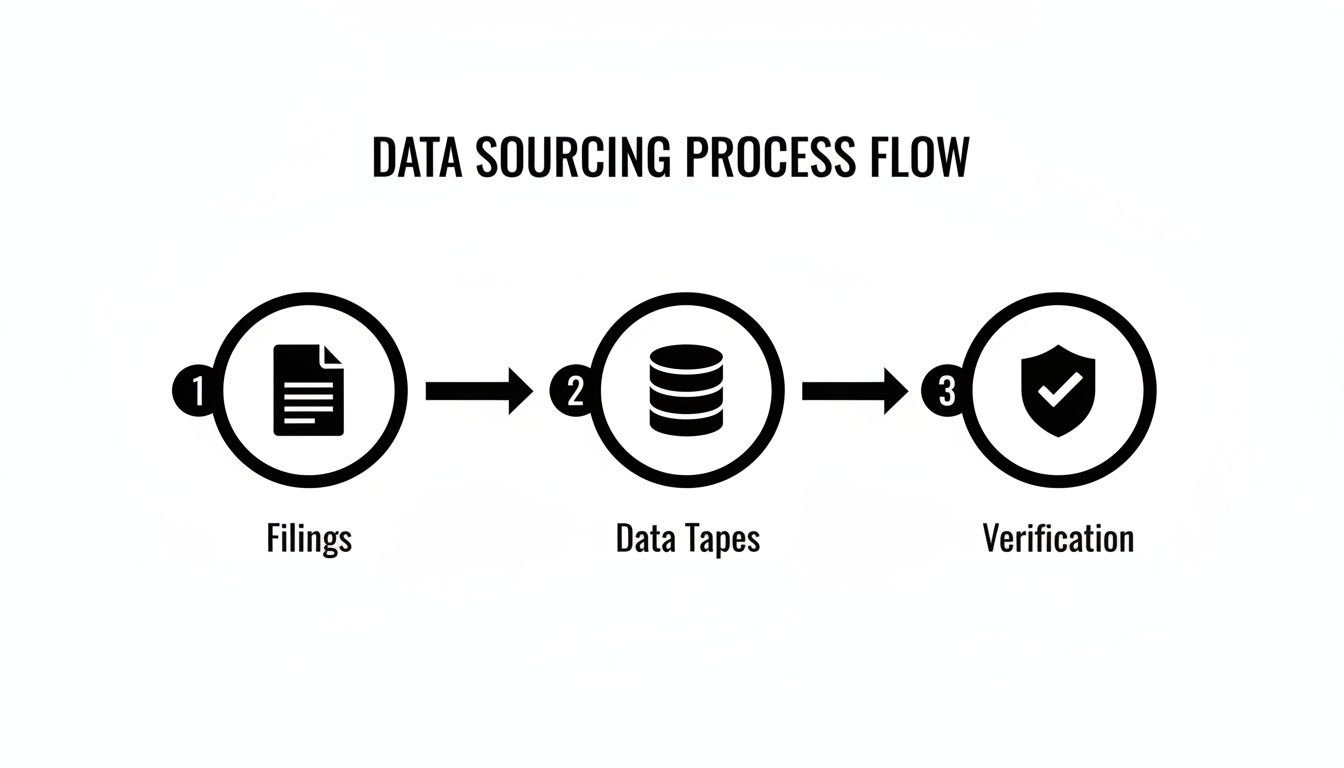
A robust comps analysis depends entirely on the quality and lineage of the underlying data. The most reliable inputs are found in public documents and structured data feeds, including:
- SEC Filings: Documents like the 10-K, 10-D, and 424B5 prospectus contain property-level details, financials (like Net Operating Income or NOI), and rent rolls for assets owned by public REITs or backing CMBS deals.
- Loan-Level Tapes: Found within CMBS offering documents, these spreadsheets provide granular data on every loan in a securitization pool, including property type, location, size, and original appraised value.
- Servicer Remittance Reports: These monthly reports provide ongoing performance data for loans within a CMBS trust, offering timely insights into occupancy, revenue, and delinquency status.
The core technical task is to parse these disparate sources and link them. For example, an analyst must connect a specific property mentioned in a remittance report back to its loan details in the original deal tape and, potentially, to financial disclosures in a REIT's 10-K. Establishing this clear data lineage is non-negotiable for building auditable models. This is where a well-structured API becomes essential, providing pre-linked data that connects properties, loans, and filings, turning a manual data hunt into a structured foundation.
A Programmatic Workflow for Generating Comps
Manual, one-off comp pulls in spreadsheets don't scale and lack reproducibility. A programmatic workflow, however, creates an auditable and repeatable pipeline for underwriting and surveillance. The objective is to query a large, structured dataset for properties matching specific criteria and let code handle the heavy lifting of data aggregation and adjustment.
Consider a Python script designed to find comps for a multifamily property. The workflow would be:
- Source: Access a database of CMBS loan collateral via an API (e.g., properties backing 2023 vintage CMBS deals).
- Transform: Filter the dataset for properties within a specified geographic radius, size range (e.g., 100-200 units), and of the same asset class. Extract key metrics like the most recent NOI and valuation date from linked servicer reports.
- Insight: Calculate valuation metrics like price per unit or implied cap rate for the filtered set. Apply quantitative adjustments for factors like sale date and submarket differences to normalize the data.
Here is a simplified Python snippet illustrating the concept:
import pandas as pdimport requests# Define API endpoint and parameters for the subject propertyDEALCHARTS_API_URL = "https://api.dealcharts.org/v1/properties/search"params = {"property_type": "Multifamily","city": "Austin","state": "TX","min_units": 100,"max_units": 200,"vintage_year_start": 2022}# 1. Source: Fetch data from a structured sourceresponse = requests.get(DEALCHARTS_API_URL, params=params)data = response.json()comps_df = pd.DataFrame(data['properties'])# 2. Transform: Extract and clean relevant metricscomps_df['price_per_unit'] = comps_df['last_sale_price'] / comps_df['unit_count']comps_df['implied_cap_rate'] = comps_df['latest_noi'] / comps_df['last_sale_price']# 3. Insight: Display the resulting comparable setprint("Generated Comps for Austin Multifamily Property:")print(comps_df[['property_name', 'last_sale_date', 'price_per_unit', 'implied_cap_rate']].head())
This data lineage (Source → Transform → Insight) ensures that every number in the final comp set is traceable back to its origin, making the entire analysis defensible.
Implications for Risk Modeling and AI
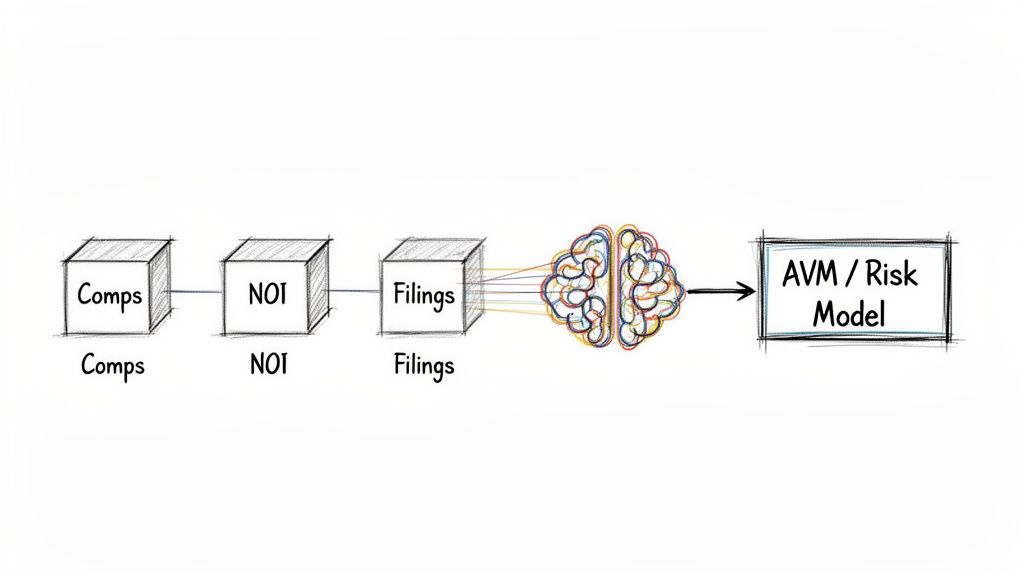
Structured, verifiable commercial real estate comps are the essential fuel for advanced financial models. When you build an explainable data pipeline, you get robust, defensible outputs that improve:
- Credit Risk Models: Granular, up-to-date comps allow for more accurate LTV and DSCR calculations, leading to better risk stratification within CMBS pools.
- Automated Valuation Models (AVMs): High-quality, feature-rich comp data trains AVMs to produce more reliable and less biased property valuations.
- Large Language Models (LLMs): Grounding an LLM in a structured, verifiable comp dataset via an API allows it to answer nuanced questions about collateral performance with factual accuracy, avoiding hallucinations.
This is the core principle behind the CMD+RVL Context Engine: creating a "model-in-context" environment where analytical tools are aware of the source and lineage of the data they use. In this framework, transparency and data lineage are not optional features; they are fundamental requirements for trustworthy, explainable analytics.
How Dealcharts Accelerates Comps Analysis
The data sourcing, cleaning, and linking required for a robust comps analysis is tedious, time-consuming grunt work. Dealcharts was built to solve this data engineering problem. It connects disparate datasets—SEC filings, servicer remittance reports, deal structures, and property details from deals like COMM 2012-CCRE1—into a single, verifiable context graph. This eliminates the manual pipeline-building, allowing analysts to find, analyze, and share commercial real estate comps in minutes. The platform enables the publication of verified charts with embedded citations, bringing a level of transparency and reproducibility that is critical for investment memos and risk committees.
Conclusion
The legacy approach of manual, opaque comp pulls is insufficient for the demands of modern structured finance. The analytical edge now comes from programmatic, verifiable workflows that produce comps traceable back to their source. By integrating clean, structured data with clear lineage into analytical pipelines, analysts and quants build defensible models that hold up under scrutiny. This commitment to explainability, a core tenet of the CMD+RVL framework, is what separates true analysis from the noise, creating a foundation for financial models that are truly context-aware.
Article created using Outrank