EDGAR 10-D API Guide
How to Use the EDGAR 10-D API for ABS Surveillance
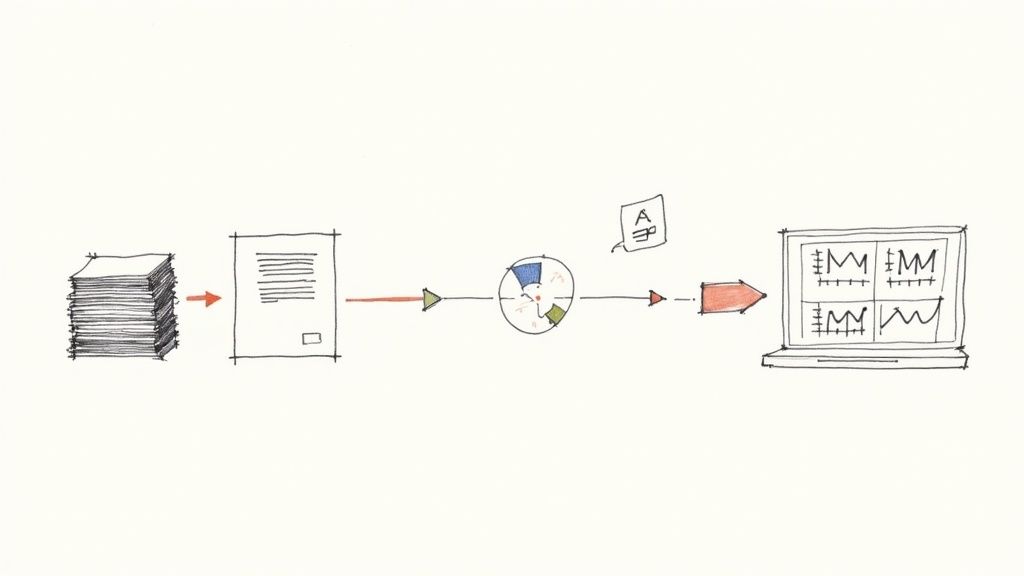
For structured-finance analysts and data engineers, Form 10-D filings are the primary source of truth for Asset-Backed Securities (ABS) performance. Manually extracting remittance data from these monthly reports is a slow, error-prone, and unscalable workflow. The EDGAR 10-D API for ABS provides programmatic access to this critical information, enabling automated surveillance, verifiable risk modeling, and deeper contextual analysis. This guide covers the technical workflow for accessing, parsing, and structuring this data, turning raw regulatory filings into a model-ready, explainable data pipeline. You can visualize and cite the final structured datasets on platforms like Dealcharts.
Market Context: Why Form 10-D Is the Pulse of the ABS Market
Form 10-D is the regulatory filing that discloses the periodic performance of an Asset-Backed Security. It is the mechanism for market transparency, delivering the ground-truth data on collateral performance, cash flow distributions, and credit enhancement levels directly to investors. For analysts performing surveillance on CMBS, RMBS, or auto ABS, these filings are not just a compliance artifact—they are the granular, monthly heartbeat of a deal.
The core of a 10-D is the attached servicer or trustee report, which contains the metrics that feed quantitative models and surveillance dashboards. Key data points include:
- Distribution Data: Principal and interest payments allocated to each tranche.
- Delinquency Status: Stratification of the underlying loans by payment status (e.g., 30, 60, 90+ days past due).
- Prepayment Speeds: Data on voluntary and involuntary principal repayments.
- Credit Enhancement: Current levels of overcollateralization, subordination, or excess spread.
- Cumulative Losses: Realized losses on the asset pool since inception.
The primary technical challenge is that this data is often locked in unstructured formats like plain text or non-standard HTML exhibits. Servicers use varied templates, terminology, and layouts, making large-scale, automated data extraction a significant data engineering problem. As the ABS market expands and asset pools become more dynamic, the need for programmatic access to timely, reliable performance data has intensified. The bottleneck is no longer finding the filings, but reliably parsing them at scale.
Data and Technicals: Tapping Into the EDGAR 10-D API for Data
The SEC’s EDGAR API provides a RESTful interface for accessing public filings, including Form 10-D. It requires no authentication key and returns machine-readable JSON, making it an ideal source for building automated data pipelines. Analysts and developers can script HTTP requests to fetch filing metadata and links to the raw exhibits that contain remittance data.
However, the API provides the container, not the structured data itself. A query returns metadata—filing date, accession number, and a list of exhibit files—but the core performance numbers must be parsed from the linked documents.
Building an API Query
To retrieve filings for a specific ABS deal, you must first identify its Central Index Key (CIK). The CIK is the unique identifier assigned by the SEC to the issuing trust. A common workflow involves a GET request to the
endpoint. This returns a complete history of all filings for that entity. Your script can then filter these results for form type "10-D"./submissions/CIK{CIK}.json
import requestsimport time# Use a real CIK for an ABS issuer# CIK for Exeter Automobile Receivables Trust: 0001643889CIK = "0001643889"# SEC requires a custom User-Agent headerheaders = {"User-Agent": "Your Name Your-Email@example.com"}# Fetch all submissions for the CIKurl = f"https://data.sec.gov/submissions/CIK{CIK}.json"response = requests.get(url, headers=headers)submissions = response.json()# Filter for 10-D filingsrecent_filings = submissions['filings']['recent']ten_d_filings = [filing for filing in recent_filings['form'] if filing == "10-D"]print(f"Found {len(ten_d_filings)} 10-D filings for CIK {CIK}.")# To stay within the SEC's 10 requests/sec limittime.sleep(0.1)
This initial step provides a list of accession numbers and primary document names, which are used to construct direct URLs to the filing exhibits. The remittance data is typically located in exhibits like EX-101 or EX-99. You can see how these documents are linked to specific transactions, like the UBSCM 2018-C15 transaction, on platforms like Dealcharts that pre-process this data. More details on endpoints are available on the SEC's official developer resources page.
The true engineering challenge lies in parsing these exhibits, which requires robust logic to handle inconsistent formats and ensure every extracted data point maintains a clear lineage back to its source.
Example Workflow: A 10-D Parsing Pipeline
Let's operationalize the theory with a practical data extraction pipeline. The objective is to programmatically fetch a 10-D filing, download the trustee report exhibit, and parse it to extract key performance metrics into a structured format. This workflow demonstrates the core principle of data lineage: source → transform → insight.
Step 1: Identify and Fetch the Target Exhibit Using a deal’s CIK and the latest accession number from our previous script, we can locate the servicer report. This requires iterating through the exhibit list in the filing's JSON data to find the relevant document, often identifiable by its description ("Servicer Report" or similar). Once the URL to the raw HTML or TXT file is constructed, a simple GET request downloads it.
Step 2: Parse the Exhibit for Key Metrics This is the most critical and fragile step. Using a library like Python's BeautifulSoup for HTML or regular expressions for text, the script scans the document for keywords and table structures. For example, to find delinquency data, the script might search for a table header containing "Delinquency" and then extract values from the subsequent rows.
# PSEUDO-CODE for parsing logic# (Actual implementation is highly dependent on the specific exhibit's format)from bs4 import BeautifulSoupimport re# Assume 'exhibit_html_content' is the downloaded HTML of the servicer reportsoup = BeautifulSoup(exhibit_html_content, 'html.parser')# Find the delinquency table - this logic is custom for each servicer formatdelinquency_table = soup.find("table", id="delinquency_data") # Example ID# Extract data using relative positions or regex# This is where the logic gets complex and brittlethirty_day_value = delinquency_table.find(string=re.compile(r"30-59 Days")).find_next('td').textsixty_day_value = delinquency_table.find(string=re.compile(r"60-89 Days")).find_next('td').text# The goal is to create an auditable trace from raw text to a structured value.# There are many public [parsing tutorials](https://www.toonparse.com/blog/tags/tutorials) available.
The key is to create an auditable link from the raw source text to the structured output, ensuring every metric is verifiable. This programmatic workflow for deals like the Exeter Automobile Receivables Trust 2024-1 is only scalable because the SEC’s APIs, available since late 2023 for over 150 filing types, provide the necessary machine-readable access.
Step 3: Structure the Extracted Data The final step is to organize the extracted values into a clean, structured object, such as a Python dictionary. This normalized output is now ready for a database, time-series analysis, or as input for a risk model.
{"filing_date": "2024-10-15","reporting_period_end": "2024-09-30","delinquencies": {"30-59_days": 1250000.50,"60-89_days": 450000.75,"90+_days": 150000.00},"principal_distribution": 5400000.00,"cumulative_losses": 875000.25,"source_exhibit_url": "https://www.sec.gov/Archives/edgar/data/..."}
This structured, citable output transforms a messy filing into an analytical asset.
Implications: Building Explainable Models and Context Engines
Once parsed and structured, 10-D data becomes the foundation for advanced analytics. The verifiability of this data is crucial for building what CMD+RVL calls a “model-in-context”—an analytical model where every input is transparently and verifiably linked back to its source filing. This explainable data pipeline is no longer a technical luxury; it's a requirement for robust risk management, regulatory compliance, and investor trust.
This structured data also powers context engines, which are systems capable of answering complex, natural language queries that traditional databases cannot. Instead of writing SQL, an analyst can ask:
- "List all auto ABS deals from the 2023 vintage where 60+ day delinquencies have increased for three consecutive months."
- "Which CMBS servicers consistently report the lowest loan-to-value ratios across their portfolios?"
By transforming unstructured 10-D filings into a clean, interconnected knowledge base, we move beyond simple data retrieval and into contextual reasoning. This is a foundational element of more advanced systems for AI-powered knowledge management. An explainable pipeline ensures that every output from these intelligent systems is not just a calculation but a verifiable fact rooted in a specific source document.
How Dealcharts Helps
Building and maintaining a robust parsing pipeline for 10-D exhibits is a significant data engineering challenge. It requires custom logic for each servicer, continuous maintenance to handle format changes, and a sophisticated data model to link filings to deals, tranches, and counterparties. Dealcharts connects these datasets—filings, deals, shelves, tranches, and counterparties—so analysts can publish and share verified charts without rebuilding data pipelines. This allows your team to bypass the engineering overhead and focus directly on high-value analysis, risk modeling, and generating alpha, with the confidence that every data point is traceable to its source.
Conclusion
The EDGAR 10-D API for ABS is a powerful tool for automating data collection in structured finance. However, raw access is only the first step. The real value is unlocked by building a robust, explainable pipeline that transforms unstructured exhibits into clean, structured, and citable data. This approach not only improves modeling accuracy and surveillance efficiency but also provides the trusted foundation for the next generation of financial analytics. This data context and explainability are central principles of the CMD+RVL framework for building reproducible, transparent financial intelligence.
Article created using Outrank