Fannie Mae Conservatorship
Understanding the Fannie Mae Conservatorship in Structured Finance
The U.S. government's seizure of Fannie Mae in 2008 was a defining moment in modern finance. This action, known as the Fannie Mae conservatorship, was an emergency measure to prevent the collapse of the U.S. housing market. For structured-finance analysts, data engineers, and quants, it's not a historical footnote; it's a living regulatory framework that dictates capital rules, risk-sharing mechanics, and liquidity in the agency mortgage-backed securities (MBS) market. Understanding its data lineage—from regulatory filings to market impact—is critical for any programmatic analysis or risk modeling. This guide unpacks the technical details, data sources, and real-world implications of the conservatorship. You can visualize and cite the related datasets at Dealcharts.org.
Market Context: How Government Control Shapes Agency MBS
The Fannie Mae conservatorship is the operational reality of the agency MBS market. It began on September 6, 2008, when the newly created Federal Housing Finance Agency (FHFA) took control of Fannie Mae and Freddie Mac (the GSEs) to stem catastrophic losses during the subprime mortgage crisis. Facing over $100 billion in losses, the GSEs received a $187.5 billion capital injection from the U.S. Treasury, formalized through the Senior Preferred Stock Purchase Agreements (PSPAs).
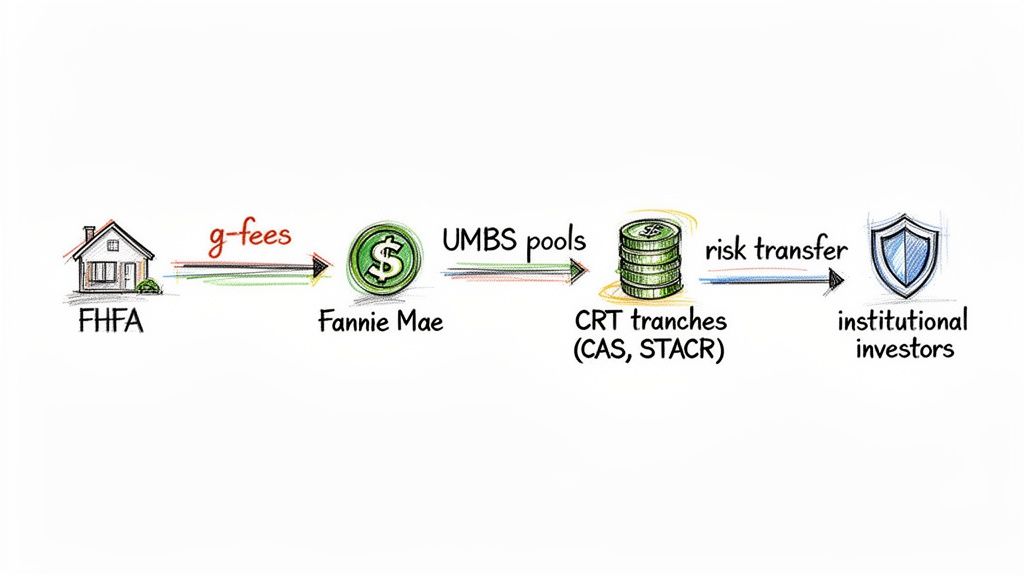
This intervention fundamentally altered the GSEs' mandate from profit maximization to market stability. For analysts, this shift requires pricing in regulatory and political risk, not just market forces. Key structural changes driven by the FHFA include:
- Credit Risk Transfer (CRT): The creation of programs like Connecticut Avenue Securities (CAS) to offload mortgage credit risk from taxpayers to private investors.
- Uniform Mortgage-Backed Security (UMBS): The standardization of GSE securities to create a single, highly liquid "to-be-announced" (TBA) market.
- Regulated Guarantee Fees (G-fees): The transformation of g-fees from a market-driven price into a policy tool directly controlled by the FHFA.
The pre-conservatorship era, exemplified by the performance of the CMBS vintage of 2007, stands in stark contrast to today's highly regulated environment. A detailed report from the New York Fed outlines the full timeline and rationale for this unprecedented government intervention.
Data Sources and Technical Access
Credible analysis of the Fannie Mae conservatorship requires a clear data lineage from primary source documents. These are not just narratives; they are machine-readable inputs for robust models. The key data sources include:
- SEC EDGAR Filings (10-K, 10-Q): These are the canonical source for Fannie Mae's financial condition. They contain the full text of the PSPAs, detailed dividend calculations, risk factor disclosures related to conservatorship, and official capital figures. For example, the filings quantify the $191.4 billion in cumulative dividends paid to the Treasury through 2023.
- FHFA Reports: The conservator publishes periodic reports on GSE performance, capital adequacy under its new framework, and mission-related activities. These documents provide the regulatory context for the numbers seen in SEC filings.
- U.S. Treasury Statements: The Treasury provides updates on its senior preferred stock position and any amendments to the PSPAs, which are critical for modeling exit scenarios.
Programmatic access is essential for reproducible research. Analysts can use Python libraries like
or custom scripts to query the EDGAR API, extract specific data points (e.g., retained earnings), and link them to regulatory announcements. This establishes an auditable trail from source to insight, a core tenet for any serious quantitative workflow.sec-edgar-api
Example Workflow: Tracing a PSPA Amendment
A practical workflow involves tracing a regulatory change from announcement to financial impact. This demonstrates explainable data lineage: source → transform → insight.
- Source: A press release from the FHFA and Treasury announces an amendment to the PSPA, allowing Fannie Mae to retain earnings up to a new, higher capital buffer (e.g., the 2019 letter agreement).
- Transform: An analyst writes a Python script to parse Fannie Mae's subsequent 10-Q filing. The script targets the "Consolidated Statements of Changes in Stockholders' Deficit" table to extract the value for "Net income attributable to common stockholders" and confirm it's now being added to "Retained earnings" instead of being paid out as a dividend.
- Insight: By automating this extraction over several quarters, the analyst can build a time-series model of Fannie Mae's capital accumulation. This verifiable data pipeline provides a quantitative basis for projecting when Fannie Mae might meet the FHFA's capital requirements, a key variable in modeling the end of the Fannie Mae conservatorship.
The difference in market stability post-reform compared to the chaos of the CMBS vintage of 2008 highlights the deep impact of these regulatory structures.
Implications for Modeling and Risk Monitoring
Understanding the conservatorship's data lineage fundamentally improves quantitative modeling and risk monitoring. When models are built with a clear link back to primary source documents, they become "model-in-context." This means:
- Explainable Pipelines: Every input can be traced to a verifiable source, such as a specific line item in a 10-K or a clause in a PSPA amendment. This is crucial for internal validation, regulatory compliance, and client trust.
- Enhanced Risk Monitoring: Models can be designed to react to regulatory "events." For example, a change in FHFA leadership could trigger a re-weighting of exit-scenario probabilities, dynamically adjusting the long-term valuation of MBS or CRT securities.
- Improved LLM Reasoning: For firms leveraging Large Language Models, structured context is paramount. Feeding an LLM with a knowledge graph that connects entities (Fannie Mae), documents (10-K), and events (PSPA amendment) allows it to reason over complex financial questions with far greater accuracy than if it were relying on unstructured public web data.
This approach transforms analysis from static reporting into a dynamic, context-aware framework, aligning with the core principles of CMD+RVL's vision for a more explainable financial system.
How Dealcharts Helps
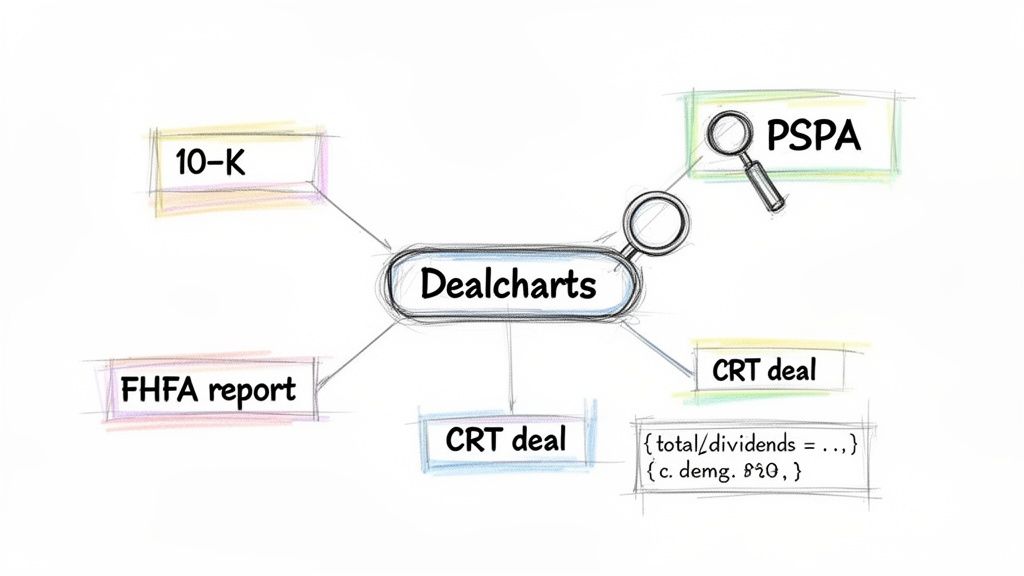
Connecting disparate data points—from FHFA reports to 10-K filings and CRT deal structures—is a significant data engineering challenge. Dealcharts solves this by providing a pre-built knowledge graph of the structured finance market. It connects these datasets—filings, deals, shelves, tranches, and counterparties—so analysts can publish and share verified charts without rebuilding data pipelines from scratch. This allows users to trace the impact of the Fannie Mae conservatorship from regulatory text to market-traded securities in a single, verifiable workflow.
Conclusion
The Fannie Mae conservatorship is more than a regulatory backstop; it is the source code for the modern agency MBS market. For quantitative professionals, the ability to programmatically access, link, and analyze its primary data sources is a competitive advantage. By establishing clear data lineage and building models in context, analysts can move beyond surface-level explainers to develop robust, reproducible, and explainable insights. This data-first mindset is the foundation of the next generation of financial analytics, as championed by the CMD+RVL framework.
Article created using Outrank