NCREIF Property Index Guide
A Quant's Guide to the NCREIF Property Index
For analysts in structured finance, the NCREIF Property Index (NPI) is the institutional-grade baseline for U.S. commercial real estate performance. It provides an essential, unleveraged signal for valuing collateral, modeling risk, and monitoring market trends in sectors like Commercial Mortgage-Backed Securities (CMBS). Understanding its construction, data lineage, and inherent biases is critical for any quantitative workflow that requires verifiable, market-level context. This guide moves beyond a surface-level overview to explain how to programmatically access and apply NPI data to real-world CMBS analysis, bridging the gap between macro indices and deal-specific insights. Platforms like Dealcharts help visualize this connection, allowing analysts to cite and share charts that map macro context directly onto specific transactions.
Market Context: Why NPI Matters in CMBS and Credit Markets
In credit markets, particularly for CMBS, a reliable benchmark for underlying real estate performance is non-negotiable. The NPI provides this benchmark by tracking the unleveraged total return of a massive, value-weighted portfolio of institutional-grade properties. Its relevance stems from its purity: by excluding leverage, the index isolates the performance of the asset itself, offering a clean signal that analysts can use to benchmark the collateral pools of CMBS deals.
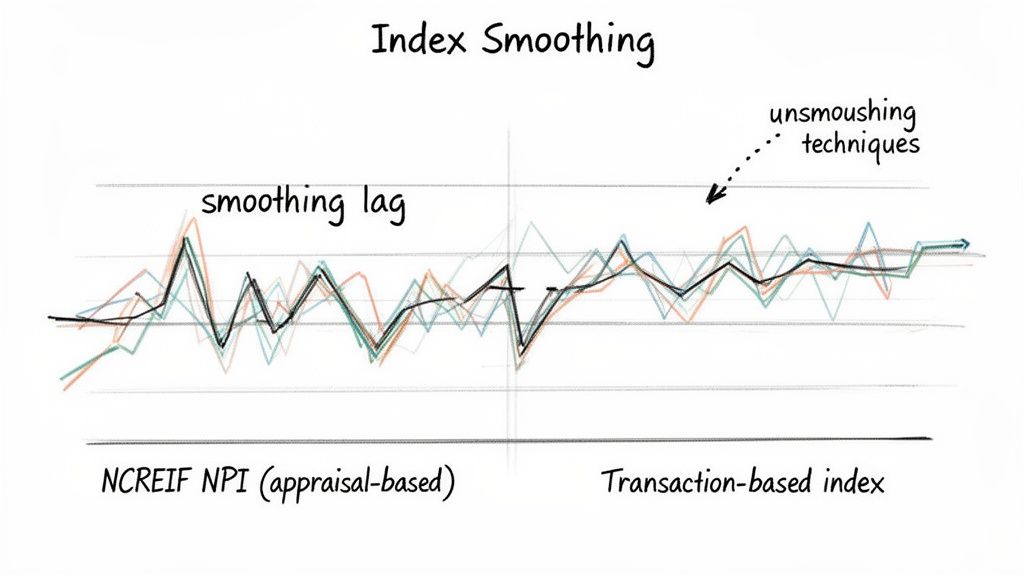
Current market trends, such as the post-pandemic stress in the office sector or rising cap rates due to monetary tightening, are reflected in the NPI's sub-indices. For a CMBS analyst, being able to compare the performance of a deal's office collateral against the NPI Office Index provides immediate, quantifiable context. Technical challenges, however, persist. The NPI is appraisal-based, which introduces a lag and "smoothing" effect that can understate volatility. This makes it crucial for analysts to understand the index's construction and account for these characteristics in their risk models.
The Data: Sourcing and Linking NPI Programmatically
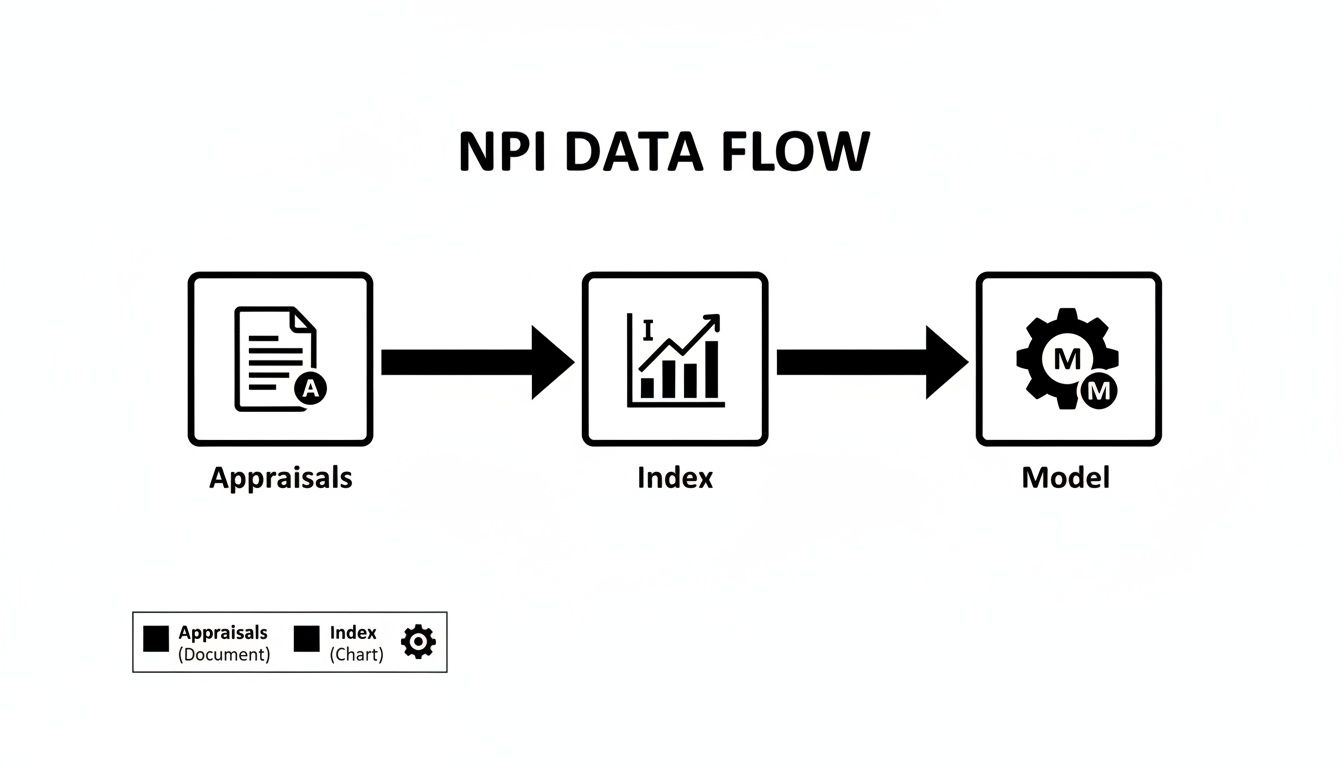
The NPI data originates from quarterly submissions by NCREIF's institutional members, who provide detailed property-level financial statements and appraisals. This data is rigorously vetted and aggregated to calculate the index's total return, which is broken down into income and capital appreciation components. This clear data lineage—from property financials to index value—is a key reason for its role as an institutional benchmark.
For programmatic use, analysts and data engineers have two primary access routes:
- Direct from NCREIF: Members and subscribers can access the data directly through NCREIF's portals. This is the most authoritative source, ensuring verifiable data lineage for models and reports.
- Third-Party Data Aggregators: Platforms like Bloomberg, FactSet, and specialized real estate data providers offer NPI data, often via APIs. This route prioritizes convenience, delivering pre-cleaned and structured data that integrates easily into existing workflows.
Once sourced, the data's power comes from linking it to other datasets. An analyst can map NPI sector trends against the collateral composition of a specific CMBS deal, such as BMARK 2023-V4, to assess relative performance. Dealcharts facilitates this by providing linkable datasets that connect macro indices to specific deals, tranches, and underlying loan tapes.
Example Workflow: Decomposing NPI Returns with Python
A practical workflow demonstrates the principle of explainability: tracing data from source to insight. The following Python snippet shows how to fetch NPI data (here, using a placeholder function for an API call) and decompose it to analyze market cycles. This programmatic approach ensures reproducibility and transparency.
The data lineage is clear: Source → Transform → Insight
- Source: Raw quarterly NPI return data from an API.
- Transform: A Python script parses the data, calculates key metrics like rolling four-quarter returns, and separates income from appreciation.
- Insight: The output reveals whether market returns are driven by cash flow (income) or valuation changes (appreciation), a critical distinction for risk analysis.
import pandas as pddef fetch_npi_data_from_api(start_date="2020-01-01"):"""Placeholder function to simulate fetching NPI data from a data provider's API.Returns a pandas DataFrame with quarterly NPI return components."""# In a real scenario, this would involve an HTTP request to an API endpoint.# Example data structure:data = {'date': pd.to_datetime(['2025-03-31', '2025-06-30', '2025-09-30']),'total_return': [0.0115, 0.0135, 0.0122], # 1.15%, 1.35%, 1.22%'income_return': [0.0105, 0.0110, 0.0108],'appreciation_return': [0.0010, 0.0025, 0.0014]}df = pd.DataFrame(data)df.set_index('date', inplace=True)return df# 1. Source: Fetch the raw datanpi_df = fetch_npi_data_from_api()# 2. Transform: Calculate rolling four-quarter total return# The formula is (1+q1)*(1+q2)*(1+q3)*(1+q4) - 1npi_df['rolling_4q_return'] = (1 + npi_df['total_return']).rolling(window=4).apply(lambda x: x.prod(), raw=True) - 1# 3. Insight: Print the transformed data to reveal the trendprint("--- NPI Quarterly Return Decomposition & Rolling Annual Return ---")print(npi_df.to_string(formatters={'total_return': '{:.2%}'.format,'income_return': '{:.2%}'.format,'appreciation_return': '{:.2%}'.format,'rolling_4q_return': '{:.2%}'.format}))# As of Q3 2025, the NPI total return was 1.22%, marking three consecutive positive quarters.# This data is based on the official NCREIF press release.# Link to source: https://ncreif.org/__static/jdj5jdewjflcvw1vytcymnhroukxdzvp/NPI-3Q2025-Press-Release(3).pdf
This simple, reproducible script creates an auditable workflow, ensuring that any derived insights can be traced directly back to the source NPI numbers, such as the official NCREIF press release.pdf).
Implications for Modeling and Risk Monitoring
Integrating structured, verifiable data like the NPI enhances financial models, risk monitoring, and even the reasoning capabilities of Large Language Models (LLMs). The key is providing "model-in-context"—supplying a model with the necessary data and its lineage to produce explainable outputs.
When a risk model flags a loan in a deal like the BANK 2020-BNK30 transaction, its output is far more powerful if it can cite the underperformance relative to the NPI Industrial Index for that same period. This transforms a black-box alert into a reasoned, data-backed insight. This approach aligns with the core themes of CMD+RVL: building explainable pipelines and context engines that allow both humans and AI to verify the "why" behind an analytical conclusion. By ensuring data is traceable and linked, we move from correlation to causation, improving the robustness of any surveillance or modeling framework.
How Dealcharts Helps
Dealcharts connects these datasets—macro indices like the NPI, SEC filings, deal structures, tranches, and counterparties—so analysts can publish and share verified charts without rebuilding data pipelines. By providing linkable, citable data, the platform enables the creation of analytical narratives where every data point is traceable to its source, fulfilling the need for explainable and reproducible financial analysis.
Conclusion
The NCREIF Property Index is more than a benchmark; it is a foundational dataset for building transparent and verifiable analytical workflows in structured finance. By programmatically accessing NPI data and linking it to deal-level information, analysts can create reproducible insights that stand up to scrutiny. This commitment to data lineage and context is central to the CMD+RVL framework, which champions explainable pipelines as the future of quantitative financial analytics.