Tenant Improvement Allowance
Understanding the Tenant Improvement Allowance in CMBS Data
In commercial real estate finance, the tenant improvement allowance (TIA) is a critical, yet often obscured, data point. It represents the capital a landlord provides to a tenant for building out or customizing a leased space. For structured-finance analysts and quants, TIA is more than a simple leasing concession; it's a key feature in underwriting models that directly impacts a property's net operating income (NOI), cash flow, and ultimately, the risk profile of loans within a CMBS pool. Understanding its data lineage—from unstructured lease abstracts to structured analytical inputs—is essential for accurate risk assessment. This guide explores how to source, interpret, and model TIA data programmatically.
Market Context: Why the Tenant Improvement Allowance Matters in Structured Finance
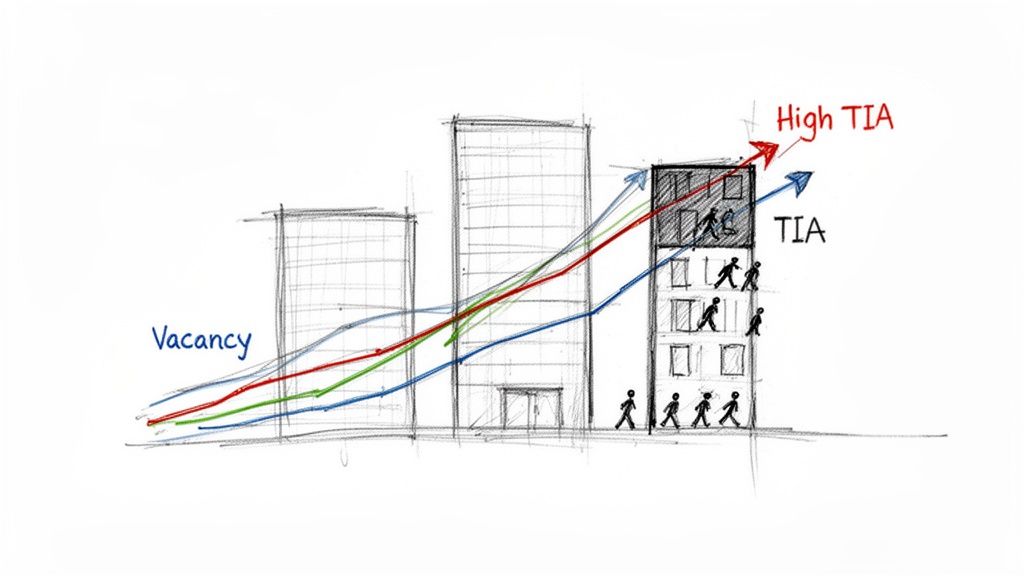
The tenant improvement allowance acts as a real-time barometer for commercial real estate market health. In a tenant-favorable market, characterized by high vacancy and softening demand, landlords offer larger TIA packages to attract and retain tenants. This trend directly erodes a property's true cash flow, even if face rents remain stable. For analysts monitoring CMBS portfolios, rising TIAs are a leading indicator of potential stress.

This dynamic has several implications for credit analysis:
- Weakening Market Fundamentals: A systemic increase in TIAs across a submarket or property type signals deteriorating supply-demand dynamics.
- Reduced Effective Rent: A large TIA is a form of shadow rent reduction. The landlord's net effective rent—the true economic income after factoring in concessions—is significantly lower than the stated face rent.
- Increased Default Risk: Properties relying heavily on TIA to secure tenants often exhibit more volatile cash flows, elevating the loan's probability of default.
The post-pandemic office sector provides a clear example. As vacancies surged, average TI allowances in major U.S. markets climbed, peaking at $97.55 per square foot in 2023 before settling to $94.69 in H1 2024, according to a deep dive into the state of tenant improvement projects. For analysts modeling CMBS collateral, like the pools in the CMBS 2023 vintage, tracking these trends is crucial for accurate cash flow forecasting.
The Data & Technical Angle: Finding TIA Data in Financial Filings
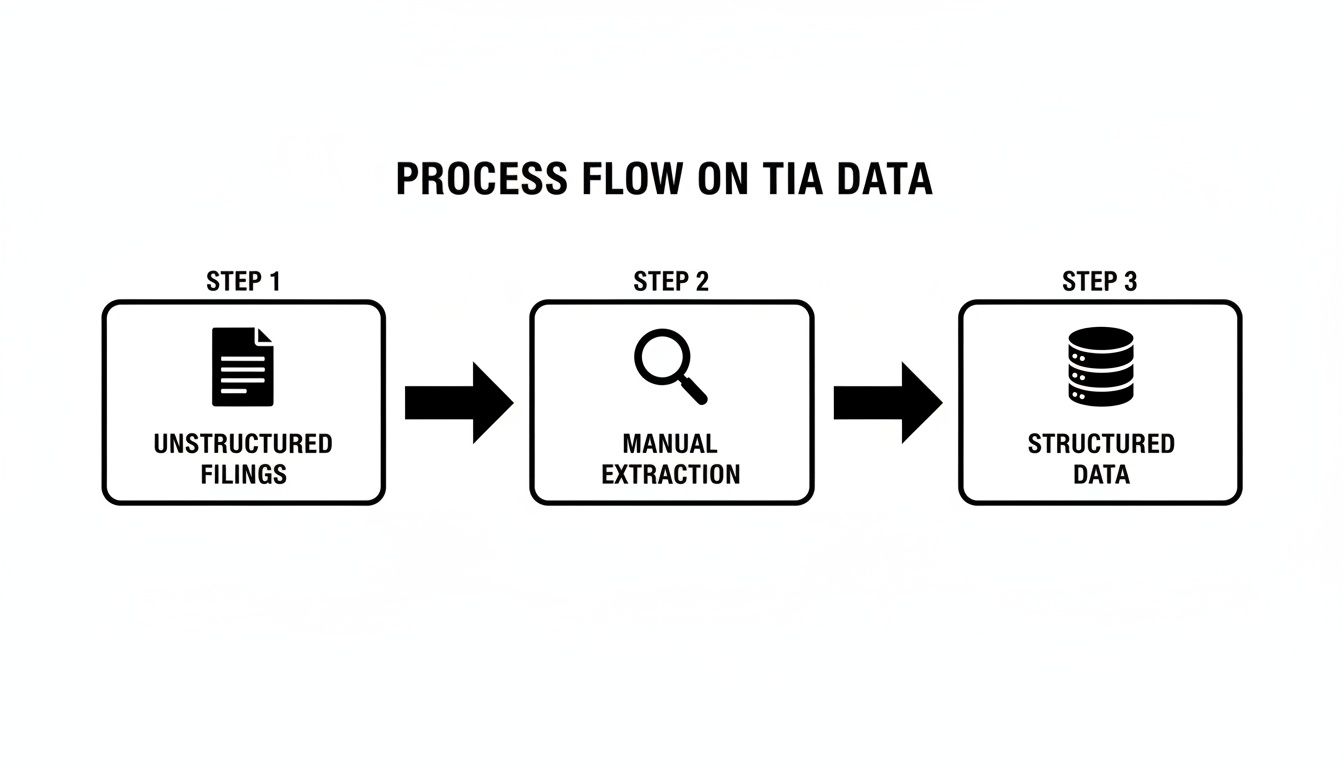
Sourcing reliable TIA data for programmatic analysis is a significant challenge. The data is typically buried in unstructured or semi-structured documents, requiring a robust data extraction and structuring pipeline.
Key data sources include:
- SEC Filings (10-K, 10-Q): Public REITs disclose leasing activities, but TIA data is often aggregated or hidden within narrative sections, making property-level extraction difficult.
- CMBS Servicer Reports: These provide property-level operating statements and rent rolls. However, TIA is frequently bundled with leasing commissions into a single "Total Leasing & Capital Costs" line item, requiring disaggregation.
- Loan Origination Files: These documents contain the lender's initial underwriting, including pro-forma TIA assumptions. While useful for historical context, this data may not reflect actual expenditures.
Manual extraction from these sources is inefficient and error-prone. A structured data platform is necessary to build a verifiable data lineage. Platforms like Dealcharts ingest these disparate documents, extract relevant entities, and link them into a cohesive knowledge graph. This allows an analyst to programmatically access TIA data for a specific property within a deal like the COMM 2012-CCRE1 transaction, complete with a traceable link back to the source filing.
This structured approach transforms the workflow from manual data hunting to programmatic analysis, enabling scalable and reproducible research.
Example Workflow: From Raw Filing to Modeled Insight
Let's illustrate the data lineage from source to insight by calculating a property's net effective rent. This workflow transforms a raw TIA figure into a critical risk metric.
Source → Transform → Insight
-
Source Data Extraction: An analyst pulls lease terms from a structured dataset derived from a CMBS rent roll.
- Lease Term: 10 years (120 months)
- Leased Space: 10,000 sq ft
- Face Rent: $50 per sq ft (PSF)
- Tenant Improvement Allowance: $100 PSF
-
Transformation (Python Snippet): A simple Python script calculates the impact of the TIA.
# Define lease parameterslease_term_years = 10leased_space_sqft = 10000face_rent_psf = 50.00tia_psf = 100.00# Calculate total valuesannual_gross_rent = leased_space_sqft * face_rent_psftotal_tia_cost = leased_space_sqft * tia_psf# Amortize TIA over the lease termannual_amortized_tia = total_tia_cost / lease_term_years# Calculate net effective rentannual_net_effective_rent = annual_gross_rent - annual_amortized_tianet_effective_rent_psf = annual_net_effective_rent / leased_space_sqft# Print the insightprint(f"Face Rent PSF: ${face_rent_psf:.2f}")print(f"Net Effective Rent PSF: ${net_effective_rent_psf:.2f}")print(f"Economic reduction due to TIA: {((face_rent_psf - net_effective_rent_psf) / face_rent_psf):.1%}")# Output:# Face Rent PSF: $50.00# Net Effective Rent PSF: $40.00# Economic reduction due to TIA: 20.0% -
Insight: The calculation reveals the property's true economic rent is $40.00 PSF, a 20% reduction from the stated face rent. This significant discrepancy directly impacts the property's NOI and its ability to service debt, altering the loan's risk profile.
This explainable pipeline—linking raw data from filings to a verifiable calculation—is fundamental for building robust risk models and is essential as these concessions are reshaping commercial real estate dynamics.
Insights & Implications for Modeling
Structuring TIA data provides context that dramatically improves quantitative models, risk monitoring, and even the reasoning capabilities of Large Language Models (LLMs) applied to finance. When a model can trace a low DSCR back to a specific set of high-TIA leases in a softening submarket, it moves beyond simple correlation to causal explanation.
This is the core principle of a "model-in-context" framework. Instead of treating a TIA figure as an isolated input, an explainable pipeline connects it to the property's location, the lease's terms, and prevailing market conditions. For example, a high TIA in a competitive market like Chicago, where build-out costs often exceed allowances, has a different risk implication than one in a less saturated market. A detailed negotiation guide for Chicago TIAs highlights how project costs can overrun negotiated allowances by over 35%.
By linking these data points, analysts can build models that don't just flag risks but explain their origins. This context-rich approach is crucial for building next-generation financial analytics, where explainability and data lineage are paramount.
How Dealcharts Helps
Dealcharts connects these disparate datasets—filings, deals, shelves, tranches, and counterparties—so analysts can publish and share verified charts without rebuilding data pipelines. By providing programmatic access to structured TIA data linked directly to its source documents, Dealcharts eliminates the manual, error-prone work of data extraction. This allows quantitative analysts and data engineers to focus on building and refining risk models, confident in the integrity and lineage of their underlying data.
Conclusion
The tenant improvement allowance is more than a lease term; it's a critical signal of market health and asset-level risk. For professionals in structured finance, building models on verifiable, context-rich data is no longer optional. By embracing explainable data pipelines that trace information from unstructured filings to actionable insights, analysts can move beyond surface-level metrics to develop a deeper, more accurate understanding of credit risk in CMBS.
Article created using Outrank