Whole Business Securitisation
Programmatic Analysis of Whole Business Securitisation
When structured finance analysts hear "securitisation," they typically picture a static pool of assets—mortgages, auto loans, or credit card receivables. A whole business securitisation (WBS) operates on a different logic. Instead of isolating a fixed asset portfolio, a WBS securitises the entire future cash-generating engine of a company, from its brand royalties to its franchise agreements. This guide explores the technical structure, data sources, and programmatic analysis required to model these complex instruments. For analysts monitoring esoteric assets or developers building data pipelines, understanding the unique risks and data lineage of a WBS is critical. Using platforms like Dealcharts, professionals can visualize and cite the underlying data without manually parsing unstructured filings.
Market Context for Whole Business Securitisation
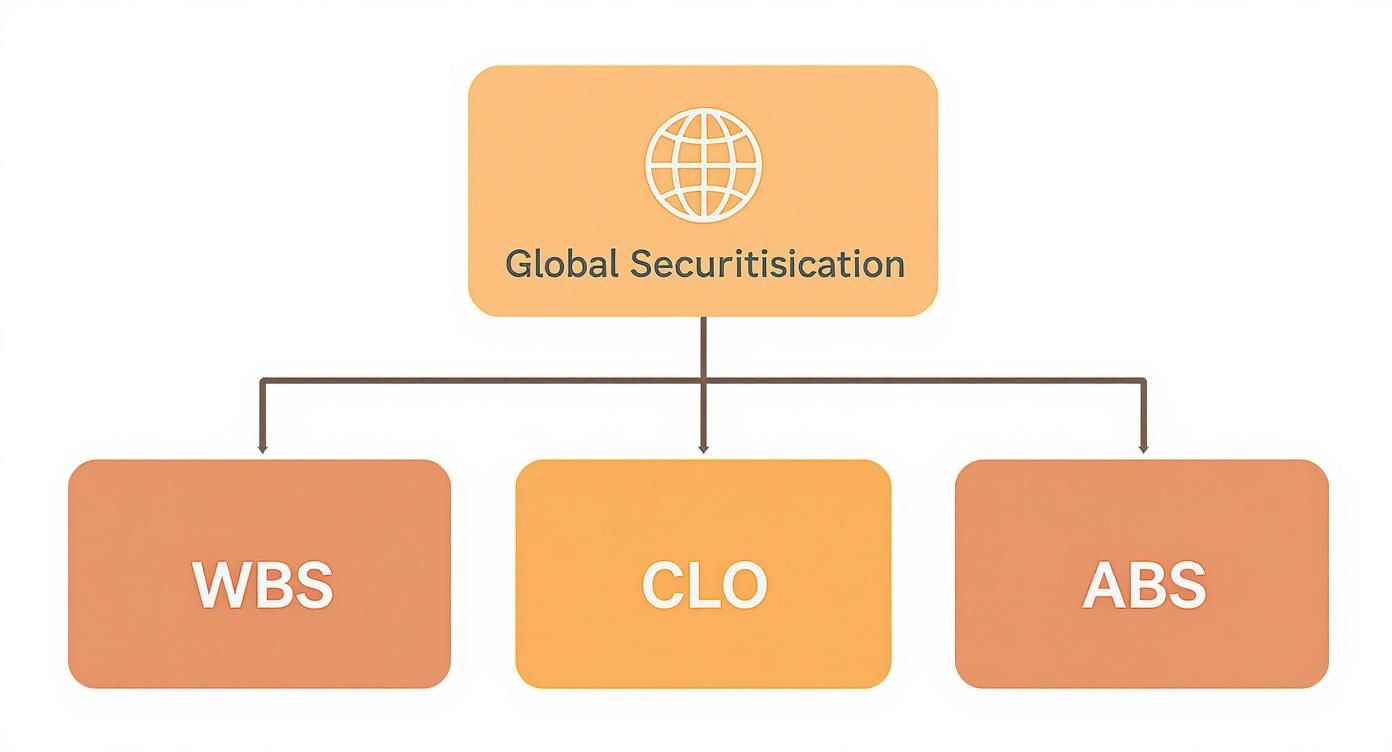
In the broader securitisation market, whole business securitisation is a niche but strategically vital tool. While Auto ABS and CMBS deals are standardized and issued in high volume, WBS provides bespoke financing for mature, cash-flow-stable businesses that don't fit into traditional asset-backed frameworks. These are often asset-light companies whose primary value lies in intangible assets like brand equity, intellectual property, and long-term contracts—think quick-service restaurant chains, pub operators, or fitness centers.
Investor appetite for esoteric assets is growing, driven by a search for yield and diversification away from crowded investment-grade corporate bonds. As institutional investors become more sophisticated, the unique risk-return profile of a well-structured WBS becomes more attractive. However, this complexity presents technical challenges for analysts. Unlike a pool of auto loans with predictable amortisation schedules, a WBS is tied to the operational fate of an enterprise. This introduces qualitative risks—management competence, brand reputation, competitive threats—that are notoriously difficult to quantify and require a blend of corporate credit analysis and structured finance modeling.
The Data and Technical Architecture of a WBS
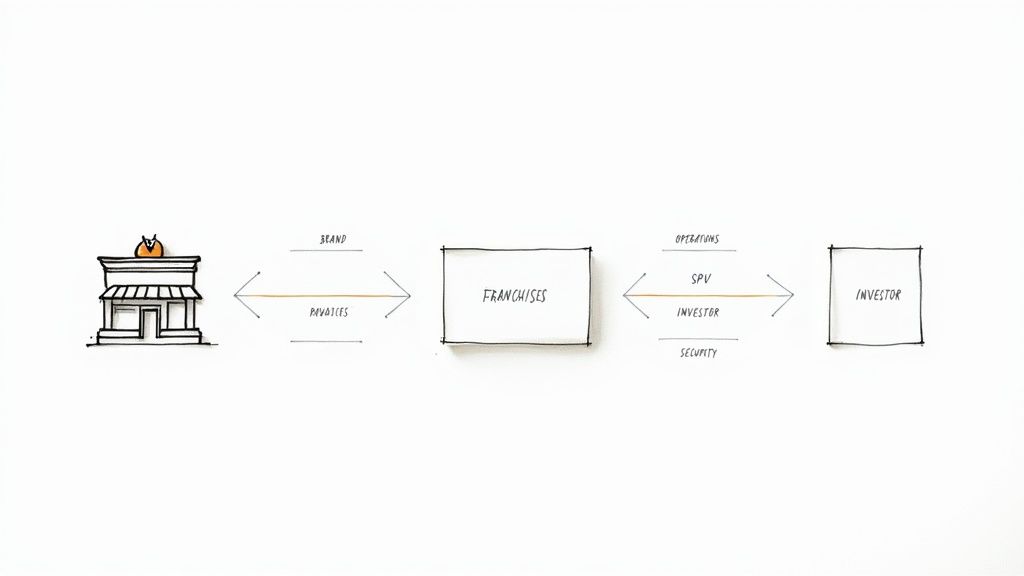
The core of a WBS is a legal structure designed to isolate an operating company's income-generating assets from its bankruptcy risk. This is achieved by creating a bankruptcy-remote Special Purpose Vehicle (SPV) that purchases the assets in a "true sale." The data lineage for any analysis begins with the legal filings that define this structure and its performance.
For U.S.-based deals, the primary data sources are public filings submitted to the SEC's EDGAR database:
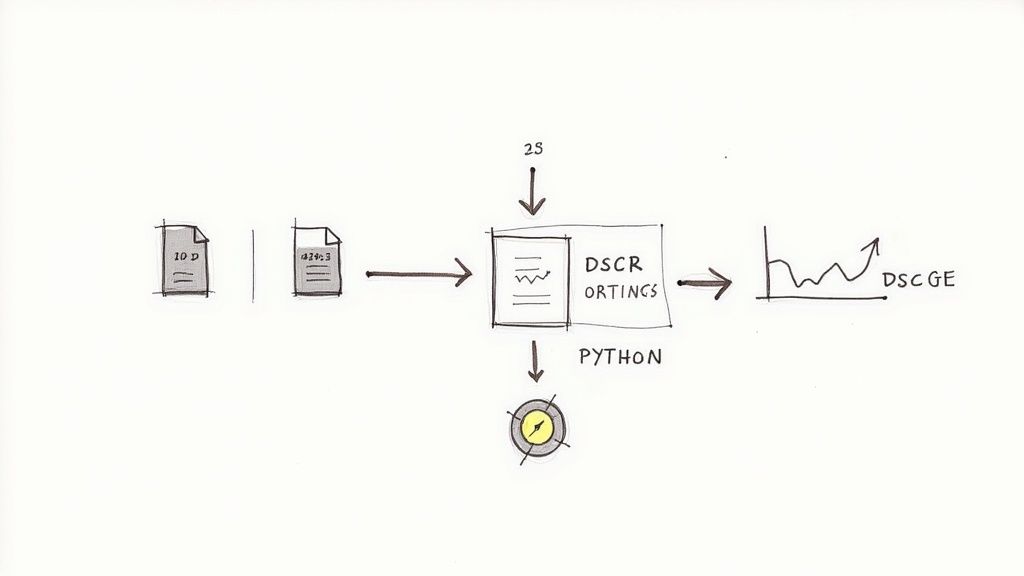
- 424B5 Prospectus: The deal's blueprint. This document details the initial collateral (IP, franchise agreements), the capital structure (tranches, subordination), and the precise rules of the payment waterfall.
- 10-D Remittance Reports: Periodic servicer reports containing performance metrics. Analysts parse these filings to extract key performance indicators (KPIs) like revenue, expenses, and the Debt Service Coverage Ratio (DSCR).
Accessing and structuring this data is the primary challenge. Analysts and data engineers can programmatically access these filings via the EDGAR API, but parsing the unstructured HTML or text to extract specific tables and values requires custom scripts using tools like Python with libraries such as BeautifulSoup and regular expressions. This process is essential for building a time-series view of a deal's health, as seen in deals like the WFCM 2024-5C1 CMBS deal.
Example: Programmatic Workflow for WBS Surveillance
A programmatic workflow allows analysts to move from manual, periodic checks to an automated surveillance system. The goal is to establish a clear data lineage: from the raw filing to a structured insight that can be used in risk models.
This short Python snippet demonstrates a conceptual workflow for extracting the DSCR from a series of 10-D filings for a specific CIK (Central Index Key). This process transforms unstructured public data into a structured time-series dataset for analysis.
import requestsfrom bs4 import BeautifulSoupimport re# This function would call the EDGAR API to get filing URLsdef get_10d_filing_urls(cik: str) -> list:"""Fetches 10-D filing URLs for a given CIK from the EDGAR API."""# In a real application, this would involve API calls and pagination.# Returning mock URLs for demonstration.print(f"Fetching filings for CIK: {cik}...")return ["https://www.sec.gov/Archives/edgar/data/mock/filing1.html","https://www.sec.gov/Archives/edgar/data/mock/filing2.html"]def parse_dscr_from_filing(url: str) -> str:"""Parses a 10-D filing to extract the Debt Service Coverage Ratio (DSCR)."""try:# Fetch the filing contentresponse = requests.get(url, headers={'User-Agent': 'YourOrg user@yourorg.com'})response.raise_for_status()soup = BeautifulSoup(response.content, 'html.parser')# Regex to find DSCR. The pattern must be tailored to the specific filing format.# This is often the most fragile part of the process.dscr_pattern = re.compile(r"(?i)debt\s+service\s+coverage\s+ratio.*?>\s*([\d\.]+x)", re.DOTALL)match = dscr_pattern.search(str(soup))if match:# Extract the captured group (the DSCR value)return match.group(1).strip()return "DSCR not found"except requests.RequestException as e:return f"Error fetching URL: {e}"# --- Main Workflow ---# Data lineage: Source (EDGAR 10-D) -> Transform (Python script) -> Insight (Time-series DSCR)deal_cik = "0001234567" # Use the actual CIK for the WBS entityfiling_urls = get_10d_filing_urls(deal_cik)for url in filing_urls:dscr = parse_dscr_from_filing(url)print(f"File: {url.split('/')[-1]} | DSCR: {dscr}")
This demonstrates the core logic of programmatic surveillance. The process is deterministic and verifiable, ensuring any derived metric can be traced directly to its source document, a principle central to reproducible financial analysis.
Implications for Modeling and Risk Monitoring
Structuring WBS data enables a shift from static, reactive analysis to dynamic, forward-looking risk modeling. With automated data pipelines, analysts can feed real-time KPIs into models that stress-test covenants against macroeconomic scenarios. This is the essence of a "model-in-context" framework: the analytical model is only as powerful as the structured, source-verified data it consumes. An explainable pipeline ensures that every model output can be traced back to a specific line item in a public filing, eliminating the "black box" problem.
This structured context is also critical for leveraging advanced tools like Large Language Models (LLMs). An LLM tasked with analyzing raw HTML filings can only provide surface-level summaries. However, when querying a structured graph of interconnected data—linking deals like the DRIVE Auto Receivables Trust 2025-1 to their filings, tranches, and performance metrics—it can perform sophisticated reasoning. An analyst could ask, "List all franchise WBS deals where the DSCR has declined for two consecutive quarters and is within 10% of a cash trap trigger," a query impossible without a pre-built context engine.
How Dealcharts Helps
Dealcharts connects these disparate datasets—filings, deals, shelves, tranches, and counterparties—into a structured context graph. This allows analysts and developers to publish and share verified charts and insights without the overhead of building and maintaining complex data pipelines. By providing clean, linked data with transparent lineage, the platform accelerates the transition to more powerful, explainable financial analytics.
Conclusion
The analysis of a whole business securitisation demands a synthesis of corporate credit fundamentals and structured finance mechanics. The future of mastering these complex instruments lies in programmatic surveillance and building explainable data pipelines. By transforming unstructured public filings into structured, verifiable data, analysts can build more resilient models, anticipate risks before they materialize, and unlock a deeper level of insight. Frameworks like CMD+RVL provide the conceptual blueprint for these context engines, enabling a more reproducible and auditable approach to financial analytics.
Article created using Outrank