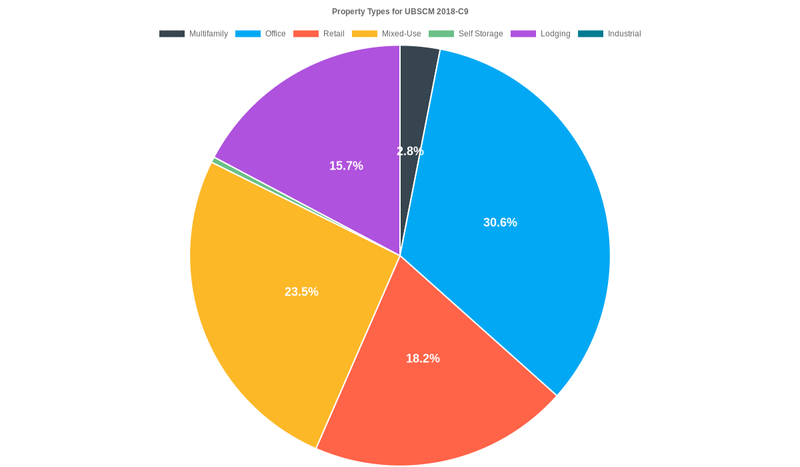
Property Types - UBSCM 2018-C9
31.9% of the UBSCM 2018-C9 loans are backed by office collateral.
Chart Summary
31.9% of the UBSCM 2018-C9 loans are backed by office collateral as of 2024-12-30 according to Edgar sec.gov filings.
Prompts
Explore a variety of thoughtfully crafted prompts below, each tailored for specific use cases. Each card includes a convenient copy-paste button that lets you seamlessly transfer the prompt into your favorite AI tool. Whether you're using ChatGPT, Google Bard, or Claude, these prompts are designed to help you unlock new insights and ideas. Simply click 'Copy' to get started!
Summarize Property Type Distribution
Summarize the property type distribution chart for UBSCM 2018-C9. Break down the percentage of the pool contributed by each property type (e.g., Office, Retail, Multifamily, etc.). Highlight the largest property type and its significance in terms of market demand and risk diversification.
Highlight Dominant Property Types
Identify the dominant property types in the property type distribution chart for UBSCM 2018-C9, focusing on those that make up more than 20% of the pool. Discuss how their dominance reflects current market trends and what this indicates about the securitization's exposure to specific sectors.
Compare to Market Averages by Property Type
Compare the property type distribution chart for UBSCM 2018-C9 to average property type distributions for similar CMBS deals issued since 2017. Highlight any deviations, such as a higher-than-average allocation to Multifamily or Lodging, and explain how this may indicate specific market conditions or strategic underwriting decisions.
Visualize Risk Concentration by Property Type
Create a bar chart comparing the property types in UBSCM 2018-C9 by their percentage of the pool. Highlight the top three property types with distinct colors and provide annotations to explain their potential risks and rewards, particularly in the context of recent industry trends.
Analyze Sector Volatility Risk
Assess the property type distribution chart for UBSCM 2018-C9 to identify property types exposed to higher market volatility (e.g., Retail, Lodging). Discuss how their percentage of the pool could impact cash flow stability and deal performance in various economic scenarios.
Trend Analysis for Dominant Property Types
Conduct a trend analysis for the dominant property types in property type distribution chart for UBSCM 2018-C9 (e.g., Office, Multifamily). Compare their allocation in this deal to their share in CMBS deals over the past five years. Discuss whether these trends align with broader market demand shifts.
Visualize Property Type Growth Potential
Based on market data, create a projection for potential growth or decline in demand for each property type represented in UBSCM 2018-C9's property type distribution chart. Use a line chart to illustrate the projected trends for categories like Multifamily, Office, and Retail over the next five years.
Assess Diversification Benefits
Evaluate the diversification of UBSCM 2018-C9's property type distribution chart by measuring the balance of property types in the pool. Discuss how a well-balanced distribution might reduce risk, and highlight any overexposure to specific property types that could increase vulnerability.
Impact of Economic Conditions on Property Types
Discuss how current economic conditions (e.g., interest rates, inflation, remote work trends) might impact the performance of property types in UBSCM 2018-C9's property type distribution chart. Highlight specific risks and opportunities for categories like Office, Retail, and Multifamily.
Create a Heatmap of Market Share by Property Type
Create a heatmap visualization showing the relative market share of each property type in UBSCM 2018-C9's property type distribution chart compared to similar CMBS deals. Use color intensity to highlight categories with above-average or below-average allocations and provide a brief analysis.
Visualize Regional Trends by Property Type
Assume regional data is available for the property types in UBSCM 2018-C9's property type distribution chart. Create a stacked bar chart showing the percentage of each property type in different regions. Discuss how regional trends might influence the performance of the deal.
Assess Performance of Smaller Property Types
Focus on the smaller property types in UBSCM 2018-C9's property type distribution chart (e.g., Self Storage, Industrial). Discuss how these categories, despite their smaller percentage of the pool, could influence cash flow stability or diversification benefits.
Risk Mitigation for Overexposed Property Types
Identify property types in UBSCM 2018-C9's property type distribution chart with an above-average share of the pool (e.g., >30%). Provide strategies to mitigate risks associated with overexposure, such as geographic diversification or stricter underwriting criteria.
Other Links
Get the data
Dataset used to create this chart
Exact curated dataset used to create this chart and other charts on this site.
XML datasets for CMBS deals
Raw XML filings from sec.gov that include this data and more for in-depth analysis.
CREFC IRP standardized datasets
Get the standardized dataset following the CREFC IRP format, ideal for advanced reporting and analysis.