Cap Rate Formula Guide
Cap Rate Formula Real Estate: An Analytical Guide
In real estate investment analysis, a primary metric for evaluating a property's potential is the capitalization rate, or cap rate. The cap rate formula provides an unlevered measure of an asset's income-generating potential relative to its acquisition cost. It offers a standardized method for assessing operational performance.
Understanding The Cap Rate Formula
The capitalization rate is a fundamental concept in commercial real estate analysis. It is calculated to isolate a property's income performance from the effects of financing, allowing for direct comparisons between different assets.
By stripping away debt service, the formula reveals the property's underlying operational efficiency. This enables investors to compare two properties with different financing structures on an equivalent basis, focusing solely on which asset generates more income relative to its value.
The formula is composed of two primary inputs: Net Operating Income and Property Value. A clear understanding of these components is necessary to interpret the resulting cap rate correctly.
The Core Components
The standard formula is:
Cap Rate = Net Operating Income (NOI) / Property Value
Each component has a distinct role in the calculation.
- Net Operating Income (NOI): This figure represents the property's annual income after accounting for all operating expenses but before deducting debt service or income taxes. It is calculated by taking all rental and ancillary income and subtracting necessary operational costs like property taxes, insurance, and maintenance.
- Property Value: This is the current market value or the acquisition price of the asset. It serves as the investment base against which income is measured.
The relationship between NOI and property value determines the cap rate.
For example, a commercial property generating $750,000 in NOI with a market value of $10,000,000 has a cap rate of 7.5% ($750,000 / $10,000,000). This indicates a 7.5% annual return on the investment if it were purchased with all cash. For further calculations, various online tools are available, such as this capitalization rate calculator.
The core inputs are summarized below:
Core Components of the Cap Rate Formula
| Component | Definition | Significance in the Formula |
|---|---|---|
| Net Operating Income (NOI) | Gross rental income plus other revenue, minus all operating expenses. Excludes debt service. | The numerator. Represents the property's unlevered, pre-tax cash flow. It is the 'return' component of the equation. |
| Property Value | The current market price or acquisition cost of the property. | The denominator. Represents the 'investment' cost. It provides the basis against which the income is measured. |
| Cap Rate | The resulting percentage when NOI is divided by Property Value. | The output. A standardized metric for comparing the relative profitability and risk of different real estate investments. |
The cap rate is a benchmark that distills a property's financial data into a single, comparable percentage. This metric provides a preliminary assessment of its risk and return profile. Understanding this formula is a foundational skill for analyzing income-producing real estate.
Calculating Net Operating Income Step by Step
Before the cap rate can be calculated, its primary input, Net Operating Income (NOI), must be accurately determined.
NOI represents a property's net income before debt service and income taxes are considered. It is the clearest indicator of an asset's operational performance. The calculation is a systematic process of aggregating all income and subtracting only the relevant operating expenses.
The process begins with the property's maximum potential income and adjusts it to reflect operational realities. An accurate NOI calculation is critical; an error here will invalidate the entire cap rate analysis.
Step 1: Identify Gross Potential Income
The initial step is to determine the Gross Potential Income (GPI). This is the maximum annual revenue a property could generate assuming 100% occupancy and all rents collected for a full year.
For a 10-unit apartment building where each unit rents for $1,500 per month, the GPI is $180,000 annually ($1,500 x 10 units x 12 months). This figure represents the theoretical income ceiling.
Step 2: Adjust for Vacancy and Credit Loss
Properties rarely maintain 100% occupancy or collect all billed rent. Therefore, an adjustment for vacancy and credit loss is necessary.
This allowance, typically expressed as a percentage of GPI, accounts for unoccupied units and uncollected rent. The percentage is derived from market data for comparable properties. If similar buildings in the area have a 5% vacancy rate, that serves as a reasonable benchmark.
- Gross Potential Income: $180,000
- Vacancy Loss (5%): -$9,000
- Effective Gross Income (EGI): $171,000
The result is the Effective Gross Income (EGI), which provides a more realistic estimate of collectible revenue. This figure represents the true top line after accounting for typical tenant turnover and non-payment. This infographic demonstrates how the income component—the numerator—drives the cap rate formula.
As shown, an accurate NOI is fundamental to the entire equation.
Step 3: Subtract All Operating Expenses
The final step is to subtract the property's operating expenses from the EGI. These are the costs required to maintain the property and service its tenants.
Typical operating expenses include:
- Property Taxes
- Property Insurance
- Utilities (for common areas not billed to tenants)
- Repairs and Maintenance
- Property Management Fees
It is critical to distinguish operating expenses from other costs. Operating expenses do not include mortgage payments (principal and interest), capital expenditures (e.g., roof replacement), or income taxes. Including these items is a common error that incorrectly reduces the NOI.
Using the 10-unit building example, assume the following annual expenses:
- Property Taxes: $15,000
- Insurance: $5,000
- Utilities (Common Area): $3,600
- Repairs & Maintenance: $7,500
- Property Management (8% of EGI): $13,680
- Total Operating Expenses: $44,780
The NOI is then calculated as follows:
Effective Gross Income - Total Operating Expenses = Net Operating Income
$171,000 - $44,780 = $126,220
The Net Operating Income for this building is $126,220. This is the property's unlevered income, which can be used in the cap rate formula to assess its value relative to its performance. This methodical process ensures the analysis is based on a solid financial foundation.
Putting The Cap Rate Formula into Practice
With a firm grasp of Net Operating Income (NOI), the cap rate formula real estate analysts use can be applied. This is where the metric functions as a practical tool for preliminary deal assessment.
The following examples demonstrate how the formula is used not only to calculate a cap rate but also to solve for other key variables, a common practice in financial analysis.
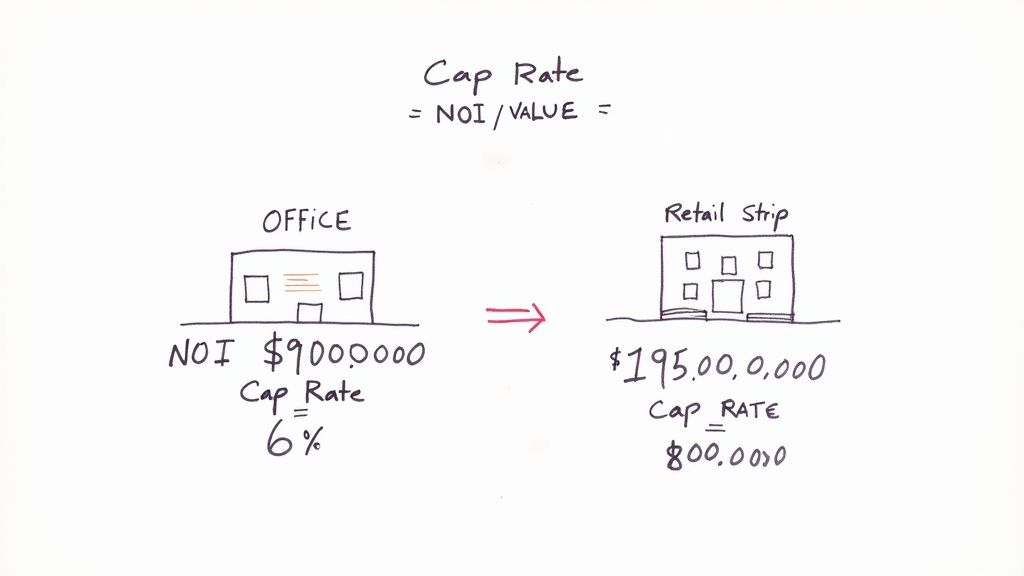
Example 1: Calculating The Cap Rate Directly
Consider a simple scenario involving a fully leased office building. After completing due diligence, an investor has verified the following figures.
The property's financials are:
- Purchase Price (Property Value): $15,000,000
- Annual Net Operating Income (NOI): $975,000
The objective is to determine the cap rate based on the asking price. The figures are entered into the standard formula.
Cap Rate = Net Operating Income / Property Value
The calculation is straightforward:
- Calculation: $975,000 / $15,000,000 = 0.065
- Resulting Cap Rate: 6.5%
The 6.5% cap rate represents the unlevered annual return on the investment. This benchmark allows the investor to compare this asset against other office buildings or different property types in the market.
Example 2: Solving for Property Value
The cap rate formula can be rearranged to estimate a property's value. This application is common when an investor knows a property's income and the prevailing market cap rate for similar assets.
An analyst is evaluating a retail strip center. The stabilized NOI has been determined, and market research indicates that comparable retail properties are trading at an average cap rate of 7.25%.
The known variables are:
- Annual Net Operating Income (NOI): $435,000
- Prevailing Market Cap Rate: 7.25% (or 0.0725)
The goal is to estimate the property's market value. The formula is rearranged as follows.
Property Value = Net Operating Income / Cap Rate
This algebraic manipulation allows for a value estimation.
- Calculation: $435,000 / 0.0725
- Estimated Market Value: $6,000,000
This calculation suggests that, based on its cash flow and market conditions, the property is worth approximately $6 million. If the asking price is $7 million, the property may be overvalued. Conversely, an asking price of $5.5 million could represent a buying opportunity.
Example 3: Determining Required NOI
The formula can also be used to determine the Net Operating Income required to meet a specific investment target. This is useful when an investor has a target purchase price and a required return, or "hurdle rate."
An investment fund is seeking to acquire a warehouse with a strict mandate to purchase assets yielding at least a 5.75% cap rate. A logistics facility is available for $22,000,000.
The question is: what is the minimum NOI the property must generate to meet the fund's investment criteria at that price?
The knowns are:
- Target Purchase Price (Property Value): $22,000,000
- Target Cap Rate: 5.75% (or 0.0575)
The formula is rearranged to solve for the required income.
Net Operating Income = Property Value x Cap Rate
This calculation establishes a clear performance benchmark for the asset.
- Calculation: $22,000,000 x 0.0575
- Required Annual NOI: $1,265,000
The fund must underwrite at least $1,265,000 in annual NOI to justify the $22 million purchase price. If the property's current NOI is only $1.1 million, the fund must either negotiate a lower price, reject the deal, or identify a credible strategy to increase income or reduce expenses to close the $165,000 gap.
This type of analysis is fundamental to deal screening, particularly in structured finance. The valuation metrics of underlying properties are critical to the structure of commercial mortgage-backed securities, as seen in instruments like the CMBS shelf from 3650 REIT on Dealcharts. The cap rate formula is a dynamic analytical tool, not merely a static equation.
How to Interpret Cap Rates Like an Analyst
Executing the calculation is simple; interpreting the result requires analytical skill. A cap rate is not just a return metric; it is a concise indicator of risk, market sentiment, and value.
A core principle is the inverse relationship between cap rates and property values. As one increases, the other decreases.
A low cap rate typically corresponds to a high property value. This is common for assets perceived as low-risk, such as a new Class A apartment building in a primary market. Investors are willing to pay a premium for stability, which increases the price and consequently lowers the initial rate of return.
Conversely, a high cap rate suggests a lower property value and generally higher risk. An example would be an older industrial building in a secondary market with short-term leases. The lower price reflects the market's demand for a higher potential return to compensate for the increased uncertainty.
The Cap Rate as a Market Barometer
Cap rates serve as an effective barometer of market sentiment regarding different property types and locations. They are a proxy for investment risk, with most transactions falling within a 4% to 12% range.
For instance, multifamily properties in a high-demand market like Miami might trade at a 4-6% cap rate, reflecting strong investor confidence. In contrast, an office building in a slower-growth market could trade at an 8-12% cap rate, indicating higher perceived risk or a less certain growth outlook.
This variance is informative. A 4.5% cap rate on a luxury retail property is not inherently "better" than an 8.5% cap rate on a suburban apartment complex. They represent two distinct risk-return profiles, priced according to prevailing market conditions.
Key Takeaway: A cap rate is not a qualitative grade. It is a relative measure of return for a specific level of risk, determined by the market at a point in time.
Context is essential for proper analysis. An investor must compare a property's cap rate not only to direct competitors but also to broader market trends. For real-time market data, explore the WFCM 2024-5C2 deal, which provides cap rate assumptions and property-level metrics for a diverse pool of commercial assets.
Factors Influencing Cap Rate Levels
Cap rates are influenced by a combination of property-specific attributes and broader market forces. The following factors can affect cap rate levels.
| Factor | Impact Leading to Lower Cap Rate | Impact Leading to Higher Cap Rate |
|---|---|---|
| Property Type & Class | Class A, multifamily, prime industrial | Class C, specialized use, older office |
| Location | Prime urban core, high-growth submarket | Secondary/tertiary market, declining area |
| Tenant Quality | Long-term leases with credit tenants | Short-term leases, local/small tenants |
| Economic Outlook | Strong GDP growth, low unemployment | Recessionary fears, high unemployment |
| Interest Rates | Low cost of debt | High cost of debt |
| Market Liquidity | High transaction volume, many buyers | Low transaction volume, few buyers |
Each element contributes to an asset's overall risk profile. A property with strong fundamentals, such as a new building in a prime location with high-credit tenants, will command a premium price, resulting in a lower cap rate. Conversely, assets with greater uncertainty must offer a higher potential return to attract investors.
Broader Economic Forces at Play
Cap rates are directly influenced by the macroeconomic environment, particularly interest rates. Changes in the cost of capital affect the entire real estate market.
- Rising Interest Rates: When interest rates increase, debt becomes more expensive. To achieve their target returns, investors must either generate more income from the property or pay a lower price. The latter is more common, which puts upward pressure on cap rates (expansion) and downward pressure on property values.
- Falling Interest Rates: When interest rates decrease, cheaper debt allows investors to pay more for assets while still meeting their return requirements. This drives cap rates down (compression) and increases property values.
Understanding this dynamic is crucial for moving beyond simple calculation to a more sophisticated analysis of market trends and future performance.
Common Mistakes and Limitations to Avoid
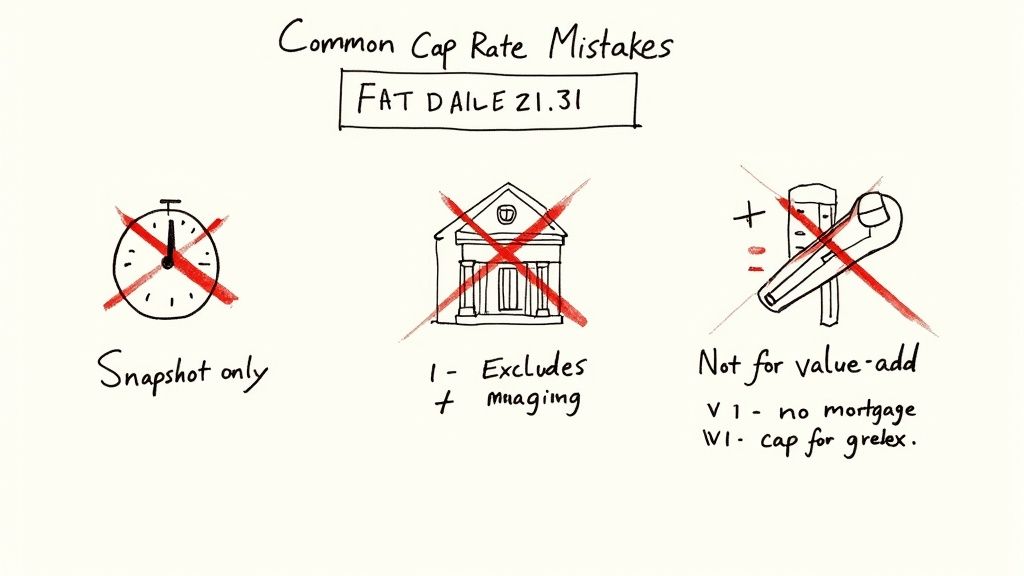
The cap rate formula real estate investors use is an effective tool for initial assessment. However, relying on it as the sole determinant of an investment's merit is a significant error.
Experienced analysts understand the formula's limitations and use it in conjunction with other metrics for a comprehensive evaluation.
The primary limitation of the cap rate is that it is a static, point-in-time metric based on a single year's Net Operating Income (NOI). It provides no information about future performance.
Forgetting Future Performance
An investment's value is heavily influenced by its future potential. The cap rate, by its design, does not account for future events that can impact returns.
Critical factors ignored by the cap rate include:
- Future Rent Growth: The formula does not incorporate scheduled rent increases, market rent appreciation, or the impact of inflation on future income.
- Major Capital Expenditures: A property may require significant capital investment in the future, such as a roof replacement. This cost is not reflected in the current cap rate.
- Changes in Operating Expenses: Future changes in property taxes or operational efficiencies can significantly alter net income over time.
Because it overlooks these dynamic elements, the cap rate is most suitable for stabilized properties with predictable cash flows. It is a less reliable indicator for assets with an expected change in financial performance.
A cap rate is a photograph, not a movie. It shows an asset's current financial position but does not indicate its future trajectory.
Misapplying the Formula to Unstabilized Properties
A common error is applying the standard cap rate formula to value-add properties. These assets are acquired with the specific intent of increasing NOI through renovation, improved management, or repositioning.
A building that is 50% vacant will have a low, unrepresentative NOI. Calculating a cap rate based on this depressed income figure is misleading.
For such properties, analysts use a pro-forma cap rate. This is based on a projection of the NOI after the planned improvements are complete and the property has stabilized. The distinction is critical. Using a trailing NOI for a value-add property will make it appear overvalued, while a pro-forma analysis reveals the potential that is being acquired.
Confusing Cap Rate with Overall Return
Equating the cap rate with total return on investment (ROI) or cash-on-cash return is a frequent mistake. These are distinct metrics that measure different aspects of performance.
A cap rate measures a property's unlevered return and intentionally excludes financing. Cash-on-cash return, however, calculates the return on the actual equity invested (the down payment) and is therefore dependent on the mortgage.
- Cap Rate: Measures the property's intrinsic profitability, independent of financing.
- Cash-on-Cash Return: Measures the return on the investor's specific equity contribution.
- Total ROI: A comprehensive measure that includes both cash flow and property appreciation over the entire holding period.
An investor who assumes a 7% cap rate will translate to a 7% return on a leveraged investment will be incorrect. Understanding these limitations allows the cap rate to be used appropriately as a screening and comparison tool, before a more detailed discounted cash flow (DCF) analysis is performed to develop a complete investment thesis.
Advanced Applications in Real Estate Finance
The cap rate formula is not limited to individual property analysis; it is also a fundamental tool in institutional finance. At this level, the metric is a critical input for complex financial models and large-scale investment strategies.
This is particularly true in structured finance. When investment banks originate Commercial Mortgage-Backed Securities (CMBS), they assess the value of the underlying real estate collateral. The market cap rate is a primary tool for this valuation and for understanding the credit quality of the security.
Valuing CMBS and Modeling Risk
Rating agencies also rely heavily on cap rate data to model the potential performance of loan portfolios under various economic stress scenarios. For example, they analyze how a 100-basis-point increase in market cap rates—known as "cap rate expansion"—would impact property values across a pool of loans.
This is a core component of how they assign credit ratings to the different tranches of a CMBS transaction. A pool of loans collateralized by properties with low, stable cap rates is considered lower risk than a pool backed by properties with higher, more volatile rates. These dynamics can be observed in specific transaction data, such as the details available for the WFCM 2024-5C2 transaction on Dealcharts.
By applying a "stressed" cap rate to a property's net operating income, analysts can estimate a downside valuation. This helps quantify the potential loss if the borrower defaults, providing a data-driven foundation for risk assessment in securitized products.
Data-Driven Market Analysis
Institutional investors now use advanced data analytics to map cap rate trends with high precision. By analyzing data from thousands of transactions, they can identify patterns across markets and submarkets, revealing opportunities and risks that are not apparent from a single-asset perspective.
This macro-level analysis can highlight:
- Cap Rate Compression: Markets where cap rates are decreasing, indicating rising property values and strong investor demand.
- Cap Rate Expansion: Areas where rates are increasing, which may signal market softening or heightened investor risk aversion.
By visualizing this data, large-scale investors can make informed strategic decisions, such as allocating capital to growth regions or reducing exposure to markets showing signs of weakness. This demonstrates how the simple cap rate formula real estate investors use is scaled into a cornerstone of modern financial strategy. For practical application, review the JP Morgan CMBS shelf to see how cap rates are applied across hundreds of properties in active CMBS transactions.
A Few Common Questions About the Cap Rate Formula
We have covered the mechanics and applications of the cap rate formula. However, several practical questions frequently arise. Addressing these common queries can help solidify an understanding of this metric.
So, What's a "Good" Cap Rate?
There is no single "good" cap rate. The appropriate cap rate is relative and depends on the asset type, market conditions, and an investor's risk tolerance.
A 5% cap rate may be considered strong for a new, fully-leased apartment building in a primary metropolitan area. The low rate reflects the asset's stability, high investor demand, and low perceived risk. In contrast, an investor might require a 10% cap rate for an older, partially vacant retail center in a secondary market. The higher rate compensates the investor for taking on greater risk and future uncertainty.
The right cap rate is the one that adequately compensates an investor for the specific risks associated with a property, relative to other available investment opportunities.
How Does My Loan Affect the Cap Rate?
It does not, which is an intentional feature of the formula.
The cap rate is designed to measure the property's unlevered income-generating capacity. By excluding debt service (the mortgage payment), it provides a standardized way to compare the operational performance of different properties. It answers the question: "How profitable is this asset on its own?"
To analyze an investment's performance including specific financing, other metrics such as the Cash-on-Cash Return are used.
Can I Use This for a Single-Family House?
While it is technically possible, the cap rate is not the standard tool for valuing single-family homes.
The cap rate formula is most effective for commercial properties where income generation is the primary purpose. The value of a single-family home is influenced by non-income factors such as aesthetics, school districts, and comparable sales prices.
For this reason, appraisers and investors typically use the sales comparison approach (comps) and, in some cases, the Gross Rent Multiplier (GRM), as these methods provide a more accurate valuation for that asset class.
Article created using Outrank