Cap Rate Pro Forma Guide
Building a Defensible Cap Rate Pro Forma: A Data-Driven Guide
Staring at a property's in-place cap rate gives you a snapshot, not the full story. For analysts in structured finance underwriting CMBS, CRE CLOs, or private credit, a defensible cap rate pro forma is the core of any credible valuation. It moves the analysis from historical performance to a projection of future, stabilized value by integrating a forward-looking Net Operating Income (NOI) and market-derived capitalization rates. This approach is critical for assessing an asset's potential and its underlying risk, especially when that asset collateralizes a loan within a securitization. For context, you can visualize and cite the data for new issuance on Dealcharts.
The Pro Forma's Role in CMBS and Credit Markets
In the world of commercial real estate finance, particularly CMBS and CRE CLO issuance, valuations are rarely based on a property’s trailing twelve months (T12) performance alone. The T12 is a rearview mirror; a pro forma is the GPS. For transitional assets—a multifamily property post-renovation or an office building leasing up vacant space—the T12 NOI says little about its true income-generating capacity. The pro forma is the only way to model that future state.
Loans backing CMBS securities are almost always underwritten based on a property's projected stability, not just its T12. This forward-looking perspective is vital. A poorly constructed pro forma can lead to mispriced risk, which reverberates through the entire capital stack of a securitization. The challenge for analysts is building a model where every input—from NOI line items to the final cap rate—is traceable to verifiable data, creating a defensible data lineage that stands up to investor and rating agency scrutiny. You can see how these principles play out in the live market by exploring issuance trends on Dealcharts, like the CMBS vintage data for 2024.
The Data Sources for a Cap Rate Pro Forma
A defensible pro forma is built on a foundation of verifiable data, not assumptions pulled from thin air. The lineage of each number matters. Analysts must synthesize data from disparate sources to construct a coherent and supportable financial forecast.
Key data sources include:
- Property-Level Financials: Trailing 12-month (T12) operating statements are the baseline. These are typically found in offering memorandums or sourced directly from the seller.
- Rent Rolls: A detailed rent roll is non-negotiable. It provides tenant-by-tenant data on lease terms, rental rates, and expirations, which is critical for forecasting revenue.
- Third-Party Reports: Appraisals, property condition reports, and environmental assessments provide crucial inputs for capex, replacement reserves, and market positioning.
- Market Data Providers: Services like CoStar, Real Capital Analytics (RCA), and Reis provide transaction comparables, rent comps, and submarket vacancy/absorption data.
- Public Filings: For assets already in securitizations, EDGAR filings like Form 10-K and 10-D (servicer reports) contain historical property-level performance data, offering a transparent look at past operations. Accessing this data programmatically allows for at-scale analysis.
Connecting these sources is the core challenge. An analyst might pull T12 financials from an OM, validate rent growth assumptions using CoStar data, and cross-reference historical performance against 10-D filings for comparable properties in nearby CMBS deals.
Example: Programmatically Stress-Testing a Pro Forma
Once you've built your base case, the real work begins: understanding the model's sensitivity to key assumptions. A programmatic approach is far superior to manual spreadsheet adjustments. The Python snippet below shows a simple function to calculate a property's value based on a pro forma NOI and cap rate, incorporating acquisition costs and planned capital expenditures.
This workflow demonstrates a clear data lineage:
→Source Inputs
→Transformation (Function)
.Insight (Valuation)
def calculate_pro_forma_value(noi, cap_rate, purchase_price, capex_budget):"""Calculates the pro forma property value and return on cost.Args:noi (float): Projected stabilized Net Operating Income.cap_rate (float): The market capitalization rate (e.g., 0.06 for 6%).purchase_price (float): The acquisition price of the property.capex_budget (float): The budget for renovations or improvements.Returns:dict: A dictionary containing the pro forma value and return on cost."""if cap_rate <= 0:return {"error": "Cap rate must be positive."}# Data lineage: NOI and cap_rate are used to derive value.pro_forma_value = noi / cap_rate# Data lineage: Purchase price and capex are summed for total cost basis.total_cost = purchase_price + capex_budget# Return on Cost is a key metric for value-add deals.return_on_cost = noi / total_cost if total_cost > 0 else 0return {"Pro Forma Value": f"${pro_forma_value:,.2f}","Total Cost Basis": f"${total_cost:,.2f}","Return on Cost (Pro Forma Cap Rate)": f"{return_on_cost:.2%}"}# Example Usage:# Source Data ->projected_noi = 550000market_cap_rate = 0.065 # 6.5%acquisition_price = 5000000renovation_budget = 1000000# Transformation -> Insightvaluation_metrics = calculate_pro_forma_value(projected_noi, market_cap_rate, acquisition_price, renovation_budget)print(valuation_metrics)# Expected Output: {'Pro Forma Value': '$8,461,538.46', 'Total Cost Basis': '$6,000,000.00', 'Return on Cost (Pro Forma Cap Rate)': '9.17%'}
This approach allows an analyst to instantly run sensitivity analyses by iterating through different NOI, cap rate, or capex scenarios, identifying the model's breaking points where a deal no longer meets return thresholds. More on how rehab costs affect cap rates on WillowdaleEquity.com.
Implications for Modeling and Risk Monitoring
A well-structured cap rate pro forma with a clear data lineage has profound implications beyond a single deal's valuation. It forms the basis for more intelligent risk monitoring and portfolio management. When actual property performance deviates from the original pro forma, analysts can trace the discrepancy back to its source assumptions.
This is the essence of "model-in-context." A pro forma isn't just a static number; it’s a narrative built on a trail of data. If a property underperforms, was it due to a flawed rent growth assumption, an underestimated vacancy rate, or unforeseen capex? Without a traceable data lineage, it's impossible to diagnose the root cause. For example, digging into the underwritten vs. current metrics for loans in the 3650 REIT 2022-PF2 transaction reveals how these deviations play out in the real world.
Explainable data pipelines allow analysts and even automated systems like LLMs to distinguish between a temporary market dip and a fundamental flaw in an underwriting thesis. This context engine approach moves risk management from a reactive, lagging indicator (delinquencies) to a proactive, leading indicator (performance vs. pro forma).
How Dealcharts Helps
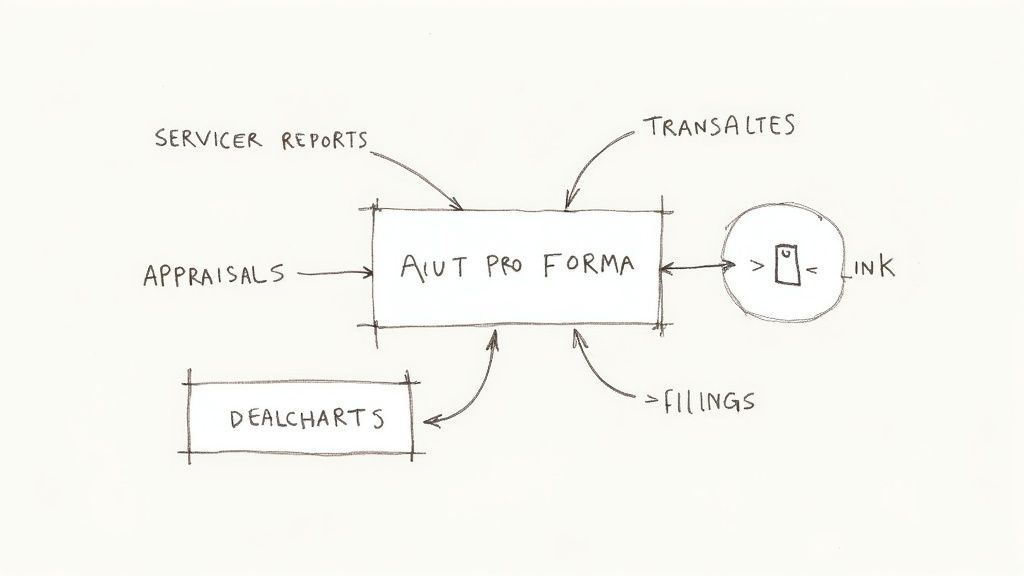
A truly effective pro forma relies on connecting disparate datasets—property financials from servicer reports, market color from appraisals, and issuance data from public filings. Manually stitching this together is slow and error-prone. Dealcharts connects these datasets—filings, deals, shelves, tranches, and counterparties—so analysts can publish and share verified charts without rebuilding data pipelines. This allows you to benchmark your pro forma assumptions against historical and market-wide data with a clear, auditable trail from source document to final analysis.
Conclusion
Ultimately, a rigorous cap rate pro forma is more than a valuation tool; it's a foundational element of disciplined risk management. Grounding every projection in verifiable data and maintaining a transparent data lineage builds a defensible argument that withstands scrutiny. This data-first mindset transforms the financial model from an opaque black box into a clear, auditable process, enabling smarter, more reliable investment decisions. This is a core principle of the frameworks being developed at CMD+RVL for reproducible, explainable finance.
Article created using Outrank