CMBS Delinquency Trends 2025
CMBS Delinquency Trends 2025: A Data-Driven Guide
Tracking CMBS delinquency trends 2025 requires moving beyond headline rates and into the verifiable data that powers them. As sustained high interest rates and structural shifts in commercial real estate continue to pressure borrowers, the ability to programmatically analyze remittance data and loan-level performance has become critical. For structured-finance analysts and quants, understanding the data lineage—from raw SEC filings to actionable insights—is the only way to accurately model risk. This guide explains the current market context, details the data sources, and provides a workflow for building a verifiable analysis. The charts and data referenced can be explored further on Dealcharts.
Market Context: Stress Across the CMBS Landscape
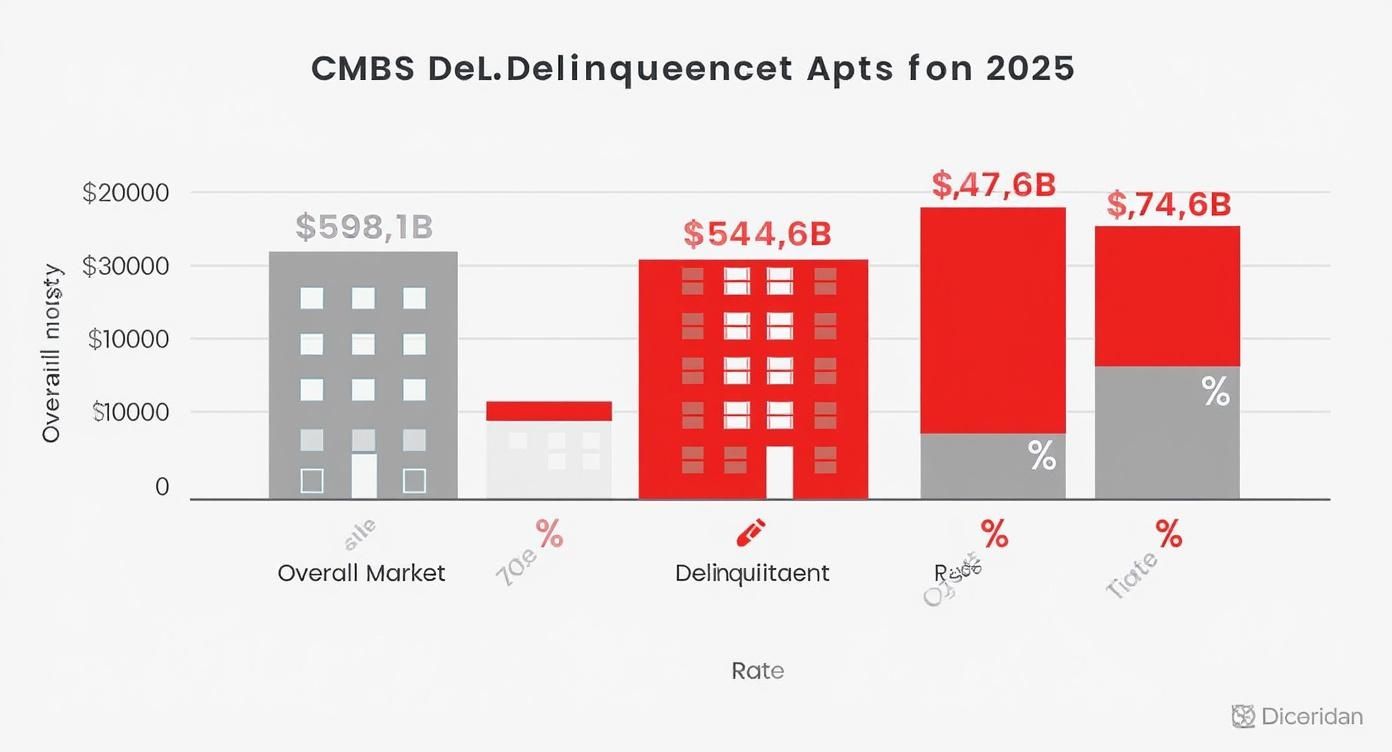
The CMBS market has entered a period of significant stress. By October 2025, the overall delinquency rate climbed to 7.46%, an increase of 23 basis points in a single month. This translates to $44.6 billion in delinquent loan balances against a total market of $598.1 billion, signaling broad pressure on borrowers. These aggregate figures, while useful, obscure the underlying drivers and sector-specific vulnerabilities that are critical for risk modeling.
For analysts, the key challenge is to disaggregate these numbers to answer precise questions:
- Sector-Specific Stress: Is distress concentrated in office, or is it spreading to retail and multifamily?
- Vintage Performance: How are newer vintages, underwritten in a different rate environment, performing relative to older ones?
- Geographic Concentration: Are delinquencies clustered in specific metropolitan statistical areas (MSAs)?
- Loan-Level Metrics: What do current Loan-to-Value (LTV) ratios and Debt Service Coverage Ratios (DSCRs) reveal about loans approaching distress?
The table below provides a snapshot of delinquency rates across major property sectors, sourced from servicer remittance data.
CMBS Delinquency Snapshot Q2-Q4 2025
| Property Sector | Q2 2025 Delinquency Rate | Q3 2025 Delinquency Rate | October 2025 Delinquency Rate | Key Driver |
|---|---|---|---|---|
| Office | 8.95% | 9.88% | 10.45% | Hybrid work, high vacancy |
| Retail | 7.10% | 7.42% | 7.71% | Maturing loans, tenant risk |
| Multifamily | 3.80% | 4.15% | 4.40% | Rent growth slowdown |
| Lodging | 5.25% | 5.50% | 5.62% | Economic uncertainty |
| Industrial | 1.05% | 1.10% | 1.12% | Generally stable |
While office remains the primary driver of distress, the steady increase in multifamily and retail rates points to broader systemic issues. A verifiable analysis must be built on data traced directly to servicer remittance reports and trustee filings. Exploring the performance of a specific 2025 CMBS vintage provides a starting point for this granular investigation.
Data & Technicals: Sourcing CMBS Performance Data
A credible analysis of CMBS delinquency trends for 2025 depends on a verifiable data lineage. The primary sources for loan-level performance data are public regulatory filings submitted to the SEC. Understanding where this data comes from and how to access it programmatically is the foundation of any quantitative surveillance framework.
The core documents for CMBS surveillance include:
- SEC Form 10-D: These are monthly distribution reports filed by a deal's trustee, containing crucial loan-level data on payment status, delinquencies, and servicer advances. They are the ground-truth source for remittance data.
- CREFC Investor Reporting Package (IRP): This standardized report from the servicer provides more granular detail on loan and property performance, including cash flow statements and property inspection notes.
The primary technical challenge is that this data is often buried in unstructured text-based exhibits or non-standard XML formats within EDGAR filings. Parsing this data consistently across thousands of deals and dozens of servicers requires a robust and flexible extraction pipeline.
Building this pipeline involves several steps:
- Automated Retrieval: Programmatically fetching the correct 10-D filings from the SEC's EDGAR database for a specified list of CMBS trusts (identified by CIK).
- Data Extraction: Parsing the filing's exhibits to extract loan-level data tables. This often requires regular expressions or custom parsers tailored to different servicer formats.
- Data Structuring & Linking: Normalizing the extracted data into a structured format (e.g., a DataFrame) and linking it to other relevant entities like deals (CUSIP), tranches, and properties.
While many firms rely on third-party data vendors, building an in-house pipeline provides transparency and ensures every data point can be traced back to its source document, a critical component for model validation and explainability.
Example Workflow: Programmatic Remittance Parsing
To demonstrate the data lineage from source to insight, here is a simplified Python snippet illustrating how to parse loan status from a raw remittance text file, such as an exhibit from a 10-D filing. This example highlights the transformation of unstructured text into structured data ready for analysis.
import pandas as pdimport re# This represents raw text extracted from a 10-D exhibitremittance_text = """LOAN_ID: 12345, STATUS: 30 Days Delinquent, BALANCE: 5,250,000LOAN_ID: 67890, STATUS: Performing, BALANCE: 12,100,000LOAN_ID: 54321, STATUS: 60 Days Delinquent, BALANCE: 8,750,000"""# Step 1: Source -> Use regular expressions to find and extract loan status infoloan_statuses = re.findall(r"LOAN_ID: (\d+), STATUS: (.*?)," , remittance_text)# Step 2: Transform -> Convert the extracted data into a structured pandas DataFramedf_statuses = pd.DataFrame(loan_statuses, columns=['LoanID', 'Status'])# Step 3: Insight -> Analyze the delinquency distributiondelinquency_counts = df_statuses['Status'].value_counts()print("Delinquency Breakdown:")print(delinquency_counts)# Expected Output:# Delinquency Breakdown:# 30 Days Delinquent 1# Performing 1# 60 Days Delinquent 1# Name: Status, dtype: int64
This workflow—Source → Transform → Insight—is the core of a verifiable analytical process. While this example is basic, scaling it across thousands of filings requires robust data pipelines that can handle format variations and link data across multiple sources. By building such tools, analysts can create surveillance systems that are timely, granular, and, most importantly, fully reproducible, establishing a clear chain of custody from the source document to the final conclusion.
Implications: Building Predictive, Context-Aware Models
Historical delinquency data provides a lagging indicator of risk. A forward-looking approach requires building predictive models that incorporate a richer set of contextual data to identify loans likely to default before they become delinquent. This is the core principle of a "model-in-context" framework, where quantitative analysis is enriched with verifiable, multi-source data to improve explainability and accuracy.
Instead of relying solely on payment status, advanced models monitor leading indicators buried in servicer reports and property-level financials. Key predictive metrics include:
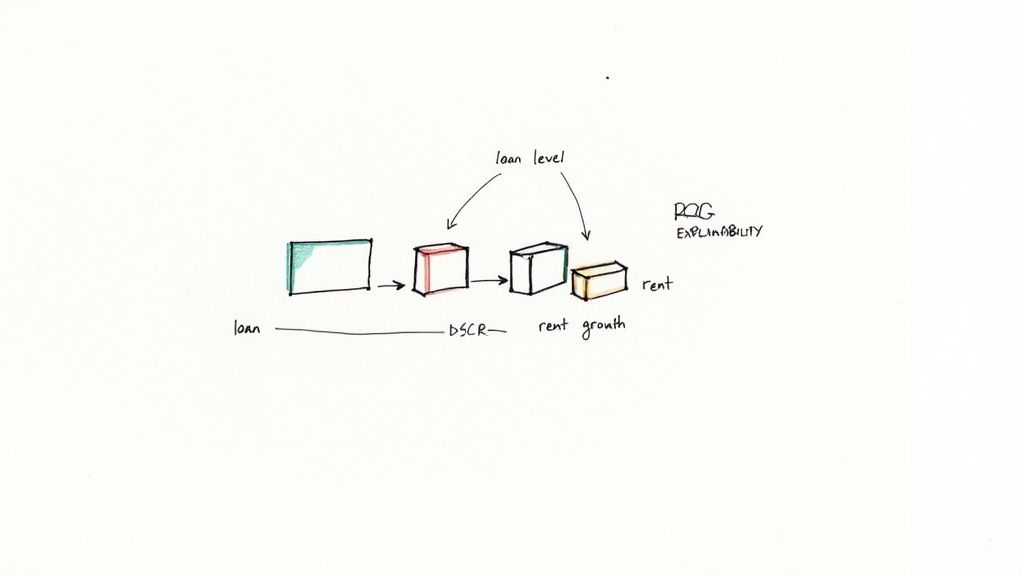
- Projected Loan-to-Value (LTV) at Maturity: A high projected LTV is a strong indicator of future maturity default, signaling a significant refinancing gap.
- Debt Service Coverage Ratio (DSCR) Trajectory: A steadily degrading DSCR, even if above 1.0x, indicates deteriorating cash flow and heightened risk.
- Submarket Health & Tenant Concentration: Models must factor in external data, such as high vacancy rates in a property's specific submarket or the declining creditworthiness of a major tenant.
This approach enhances modeling in several ways:
- Improved Risk Monitoring: It enables proactive identification of at-risk loans, allowing for earlier intervention.
- Enhanced LLM Reasoning: By providing large language models with structured, interconnected data (e.g., linking a loan's DSCR to local rent trends), their analytical capabilities are significantly improved, moving beyond simple data retrieval to contextual inference.
- Explainable Pipelines: Every prediction can be traced back to its underlying data points, satisfying model validation and governance requirements. This transparency is crucial for building trust in automated surveillance systems, such as an AI Finance Investment Analyst.
By integrating these contextual data threads, analysts can construct a clearer and more accurate forecast of portfolio risk, moving from reactive monitoring to proactive, explainable prediction. The loan-level details for a recent deal like the BMARK 2025-V14 transaction offer a practical example for applying this type of granular analysis.
How Dealcharts Helps
Building and maintaining the data pipelines required for this level of analysis is resource-intensive. Analysts often spend more time on data plumbing than on generating insights. Dealcharts connects these disparate datasets—filings, deals, shelves, tranches, and counterparties—so analysts can publish and share verified charts without rebuilding data pipelines. By providing a pre-built context engine for structured finance, it resolves the connections between SEC filings, loan tapes, and deal structures, allowing teams to focus on modeling and analysis rather than data extraction and normalization.
Conclusion
Effective surveillance of CMBS delinquency trends in 2025 requires a shift from consuming aggregate reports to building verifiable, programmatic analytical workflows. By focusing on data lineage and enriching models with contextual data, analysts can create predictive frameworks that are not only more accurate but also fully explainable. This approach, which emphasizes reproducible and context-aware analytics, is fundamental to navigating the complexities of the current credit environment.
A Few Common Questions on CMBS Delinquency
To round out the deep dive, let's tackle a few of the questions that always seem to pop up from analysts, investors, and anyone trying to get their arms around the CMBS market.
What’s the Real Difference Between Delinquency and Special Servicing?
Think of it this way: delinquency is a fever, while special servicing is the ICU.
A loan is delinquent when the borrower is simply late on a payment—usually flagged at 30, 60, or 90+ days past due. It's a clear sign of a cash flow problem at the property, but it might be temporary.
Special servicing is a whole different level of trouble. A loan gets transferred to a "special servicer" when default is either happening or just around the corner. That servicer’s job is to go into crisis mode and figure out a workout—be it a loan modification or a foreclosure—to get the most money back for bondholders.
It's important to remember that while the two are joined at the hip, a loan can technically be in special servicing without being delinquent (like when a massive balloon payment is due next month and there's no hope of refinancing).
How Exactly Do Interest Rate Hikes Hit CMBS Delinquency?
Higher rates put a nasty pincer move on CMBS borrowers, squeezing them from two directions.
First, for any loan with a floating-rate structure, a rate hike is an instant pay cut. The monthly debt service payment goes up immediately. This eats into the property's net operating income and can shove the Debt Service Coverage Ratio (DSCR) right below the critical 1.0x line, triggering a default.
Second, and this is the bigger story right now, high rates make refinancing a nightmare. When a loan's balloon payment comes due, the borrower has to go out and get a new loan. But if their property's cash flow can't support a new, much more expensive loan at today's rates, they're stuck. That's a maturity default, and it's happening a lot.
Which Property Types Are Usually the Most Volatile?
If you looked back through history, you’d point straight at lodging and retail. Their fortunes are tied directly to how much consumers are spending and the health of the broader economy, so they tend to swing wildly.
But the game has changed since 2020. The seismic shift to hybrid work has turned the office sector into one of the most distressed and unpredictable asset classes out there. In 2025, we're seeing office delinquencies blow past the peaks of the 2008 financial crisis. The old risk playbook has been rewritten.
Where Can I Find the Raw Data to Check This Myself?
For anyone who wants to get their hands dirty, the ground truth for public CMBS deals lives in official regulatory filings. This is where the verifiable data comes from.
- SEC Form 10-D: These are the monthly reports filed by a deal's trustee, and you can find them on the SEC's EDGAR database. They hold all the key loan-level performance numbers.
- CREFC Investor Reporting Packages (IRPs): These reports, put together by servicers, give you an even more granular look at property financials and loan status.
These documents are the bedrock. Of course, pulling that data and stitching it all together is a massive headache, which is why platforms exist to do the heavy lifting for you.
Article created using Outrank