CMBS DSCR Trend Analysis
A Guide to Programmatic CMBS DSCR Trend Analysis
In structured finance, the Debt Service Coverage Ratio (DSCR) is a foundational metric for Commercial Mortgage-Backed Securities (CMBS), measuring a property's ability to cover its debt service from its Net Operating Income (NOI). However, a static DSCR is merely a snapshot. For analysts, data engineers, and quants monitoring credit risk, the real insight comes from tracking this metric over time.
This guide explores CMBS DSCR trend analysis, a critical process for turning historical remittance data into forward-looking risk signals. By analyzing DSCR trends, investors can identify early warnings of deteriorating credit quality, stress-test portfolios against market shifts, and build more robust surveillance models. This programmatic approach moves beyond static reports, enabling reproducible and verifiable insights directly from source filings, a workflow you can visualize and cite using tools like Dealcharts.
Market Context: Why DSCR Trends Matter in Credit Surveillance
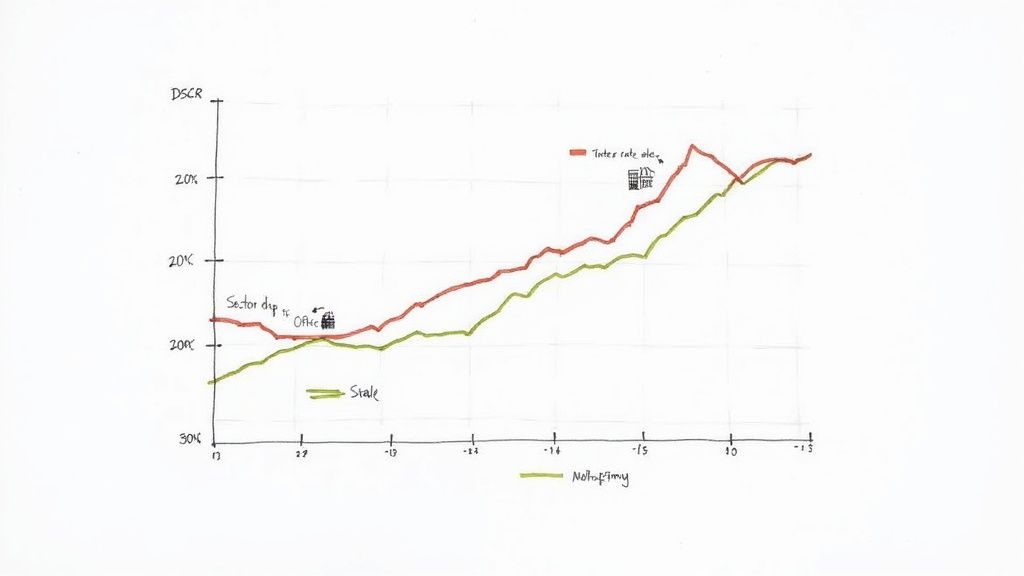
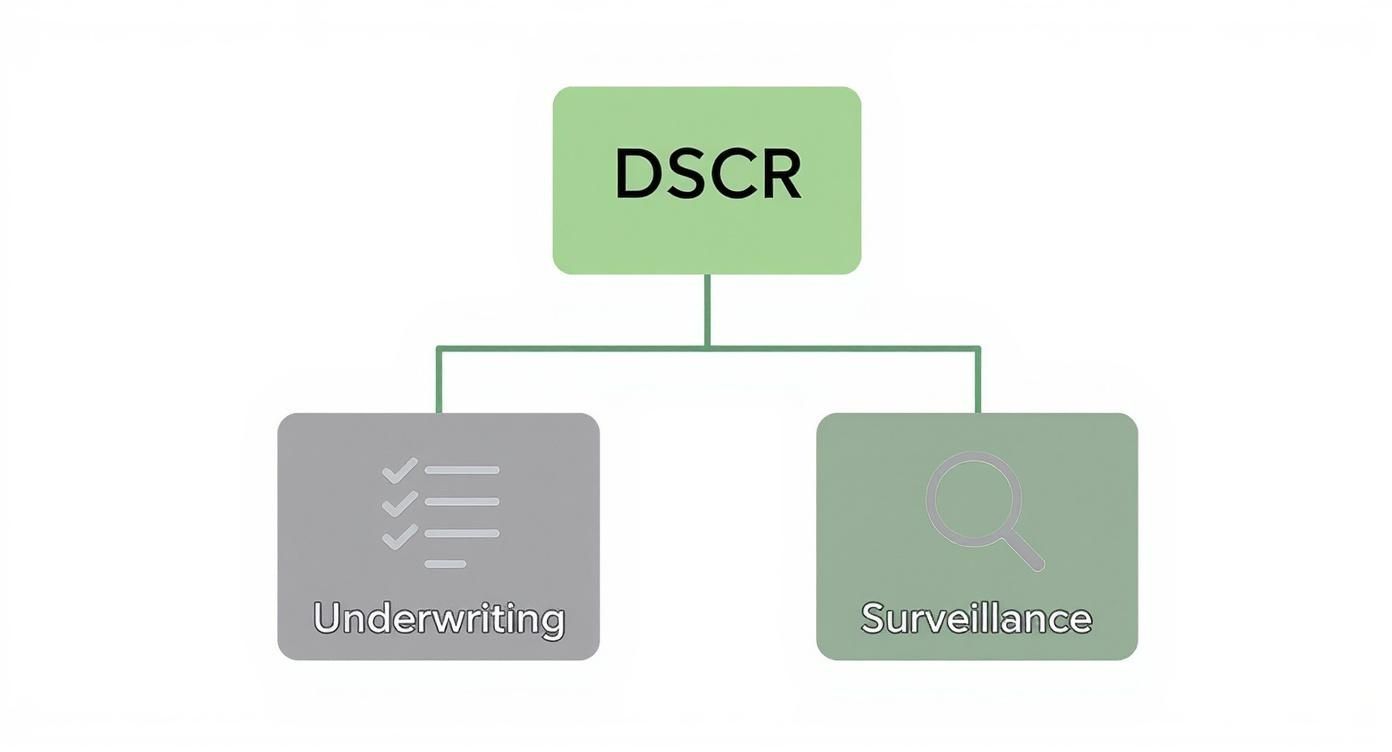
For any structured-finance analyst, DSCR trend analysis is a non-negotiable tool for surveillance and risk management. Major economic shifts, like Fed rate hikes or sector-specific downturns in office or retail, manifest first as pressure on property-level cash flows. DSCR trends provide an empirical, quantifiable view of this pressure, turning a simple metric into a leading indicator of potential defaults.
The metric's relevance has grown significantly. Between 2019 and 2022, the share of DSCR-backed loans in non-QM mortgage securitizations surged from 22% to 50%. This trend underscores its centrality in underwriting and market risk assessment. By examining DSCR trends across specific CMBS vintages, analysts can pinpoint how underwriting standards and economic conditions from different eras impact long-term performance. The primary technical challenge remains accessing and normalizing this data from disparate servicer reports and public filings to create a clean time series for analysis.
Data and Lineage: Where Does CMBS DSCR Data Originate?
A robust CMBS DSCR trend analysis depends entirely on verifiable data lineage. The core components of DSCR—Net Operating Income (NOI) and debt service—are reported across a fragmented landscape of regulatory filings and industry-specific reports. Establishing a clear path from source document to analytical insight is critical for explainability and accuracy.
Analysts and developers must programmatically access, parse, and link data from several key sources:
- EDGAR Filings (10-D, 10-K): These SEC filings provide periodic updates on deal performance and collateral status, though often in less granular, unstructured formats.
- Servicer Reports (CREFC IRP): The CRE Finance Council (CREFC) Investor Reporting Package (IRP) is the primary source for loan-level financial data. These detailed reports contain the specific NOI and debt service figures required for precise DSCR calculations.
- Trustee Remittance Reports: These documents provide the definitive record of cash flows distributed to bondholders, serving as a final point of verification for model inputs.
The technical challenge lies in stitching these disparate sources together. It requires parsing various formats (XML, XBRL, PDF), normalizing data fields, and linking records across time. A single discrepancy in a reported NOI can corrupt an entire trend analysis. This data pipeline complexity is a core problem that platforms like Dealcharts are designed to solve by ingesting, linking, and exposing this information through a structured API. When building these data pipelines, global considerations like EU data sovereignty can also come into play.
Example Workflow: Programmatic DSCR Trend Analysis
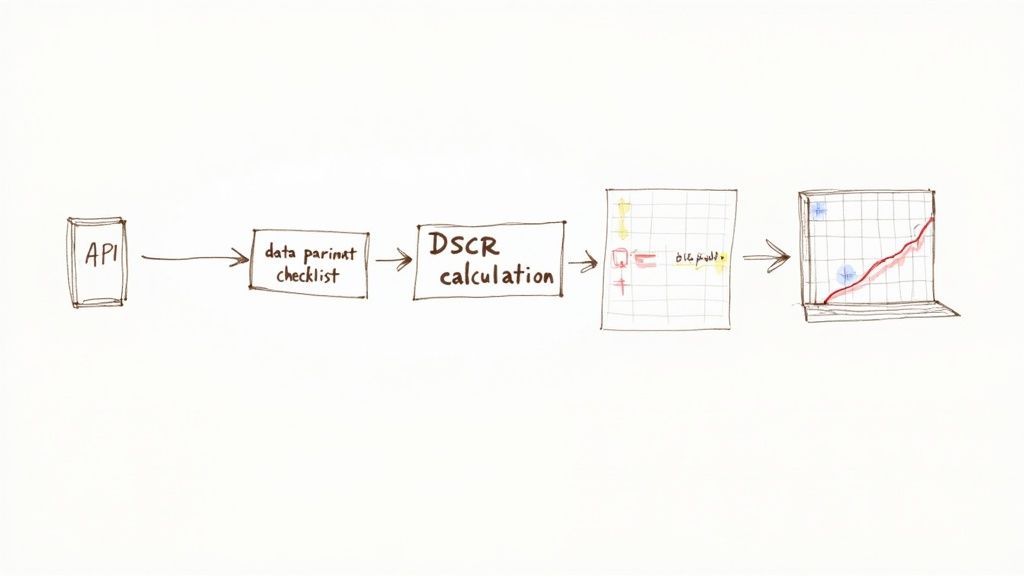
Here is a practical example of a programmatic workflow for CMBS DSCR trend analysis using Python. This snippet demonstrates how to move from raw data inputs to a visual insight with full explainability. Every step is transparent, showing the data lineage from source to transformation to insight.
We simulate fetching loan-level data for a deal like MSC 2021-L5 from an API, calculate the historical DSCR, and plot the trend. The key is that the final chart is directly traceable to the source NOI and debt service figures.
import pandas as pdimport matplotlib.pyplot as plt# 1. Source: Fetch loan-level data from an API endpoint.# This simulates pulling structured data from a source like a servicer report or a data platform API.# The data's lineage is clear: it comes from a specific loan ('loan_id': '12345') at defined reporting dates.data = {'report_date': pd.to_datetime(['2023-01-01', '2023-04-01', '2023-07-01', '2023-10-01']),'net_operating_income': [120000, 115000, 110000, 105000],'total_debt_service': [80000, 80000, 81000, 81000]}loan_df = pd.DataFrame(data)# 2. Transform: Calculate the historical DSCR.# The transformation is a transparent, verifiable formula: NOI / Debt Service.# There are no black-box calculations.loan_df['dscr'] = loan_df['net_operating_income'] / loan_df['total_debt_service']# 3. Insight: Visualize the trend to identify credit degradation.# The output directly links the source data to the analytical insight.plt.figure(figsize=(10, 5))plt.plot(loan_df['report_date'], loan_df['dscr'], marker='o', linestyle='-')plt.title('DSCR Trend for Loan 12345 (Source: Servicer Reports)')plt.ylabel('Debt Service Coverage Ratio (DSCR)')plt.xlabel('Reporting Date')plt.grid(True, which='both', linestyle='--', linewidth=0.5)plt.show()# Display the final data frame to show full transparencyprint("DSCR Trend Data with Verifiable Lineage:")print(loan_df)
This programmatic approach enables analysts to move beyond static spreadsheets and quickly identify subtle patterns, such as a steady decline in DSCR, which often serves as the earliest indicator of heightened credit risk. This is the kind of verifiable workflow seen in a deal like this 3650 REIT 2022-PF2 deal example.
Insights and Implications for Modeling and Risk
Structuring CMBS data for trend analysis delivers more than just a historical view; it provides the context needed for more accurate modeling, proactive risk monitoring, and even more sophisticated LLM-based reasoning. When a model can access not just a single DSCR value but its entire historical trajectory—along with the underlying NOI and debt service components—its predictive power increases substantially.
This structured context allows for:
- Enhanced Predictive Modeling: Machine learning models can be trained on DSCR trend features (e.g., slope, volatility) to better predict probabilities of default or transfer to special servicing.
- Smarter Surveillance: Automated alerts can be triggered by deteriorating DSCR trends rather than lagging indicators like missed payments, enabling proactive risk mitigation.
- Model-in-Context Reasoning: By linking DSCR data back to its source filings and the broader deal structure, analytical systems can provide explainable insights. An AI could reason, "The DSCR for Loan X is declining due to a 10% drop in reported NOI, as seen in the Q3 10-D filing, while its floating-rate debt service increased by 5%."
This approach aligns with the core themes of CMD+RVL: creating explainable pipelines and context engines where every data point is traceable and every insight is verifiable.
How Dealcharts Helps
Dealcharts connects these disparate datasets—filings, deals, shelves, tranches, and counterparties—into a coherent, verifiable knowledge graph. This allows analysts, data engineers, and quants to publish and share verified charts and access structured data via API without rebuilding complex data pipelines from the ground up. Instead of wrestling with PDFs and unstructured reports, teams can focus on generating and validating insights.
Conclusion
Effective CMBS DSCR trend analysis is a programmatic discipline rooted in data lineage and explainability. By systematically sourcing, transforming, and visualizing DSCR data from primary documents, analysts can move from reactive monitoring to proactive risk management. This structured, context-rich approach not only improves model accuracy but also provides the verifiable insights essential for navigating complex credit markets. Frameworks like CMD+RVL enable this shift toward reproducible, explainable finance analytics.
Article created using Outrank