Knowledge Graph for Structured Finance
Building a Knowledge Graph for Structured Finance: From Data Silos to Verifiable Insights
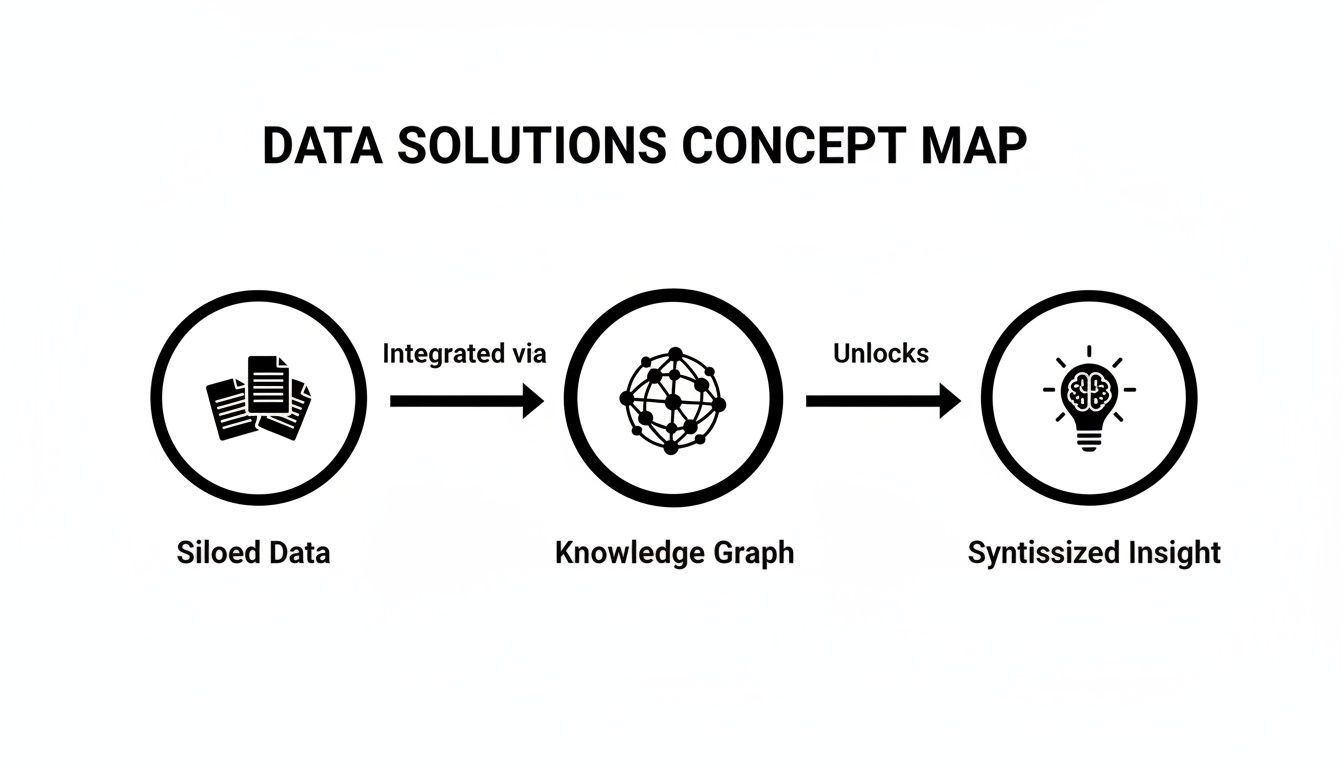
A knowledge graph for structured finance is not an abstract academic concept; it's a practical data architecture that maps the complex web of relationships between deals, tranches, loans, properties, and counterparties. Unlike traditional relational databases that store data in siloed tables, a knowledge graph builds a single, unified network of the CMBS and ABS universe. It transforms fragmented data from SEC filings and servicer reports into an queryable, model-ready asset. This approach is critical for programmatic analysis, risk monitoring, and grounding LLM applications in verifiable facts. For instance, Dealcharts uses this structure to let analysts visualize and cite the connections between a deal, its collateral, and its source filings.
The Market Context: Why Structured Finance Demands Connected Data
The structured finance market runs on a constant flow of complex, interdependent data. Analysts monitor collateral performance, credit risk, and counterparty exposure by piecing together information from disparate sources. The core challenge is that this information—buried in SEC filings like 10-Ds, 424B5 prospectuses, and dense servicer reports—lacks inherent context. A traditional database might store a loan's DSCR from a remittance report but has no native understanding of that loan's connection to a specific property, its tenant, or the parent company of that tenant, which may have exposure across a dozen other deals.
This disconnected data model creates significant operational friction and hidden risks. Without a clear map of relationships, identifying concentration risks—such as over-exposure to a single commercial tenant or special servicer across multiple vintages—becomes a slow, manual, and error-prone process. As the market grapples with shifting credit cycles and regulatory scrutiny (e.g., Dodd-Frank, Basel III), the need for verifiable, transparent, and interconnected data has never been more acute.
The Technical Angle: Sourcing and Linking the Data Universe
Building a useful knowledge graph for structured finance requires a disciplined data lineage mindset: source the raw data, transform it into structured entities, and link those entities based on real-world relationships. This process turns chaotic public and proprietary documents into a clean, connected network.
The raw materials come from a variety of sources, each with its own parsing challenges:
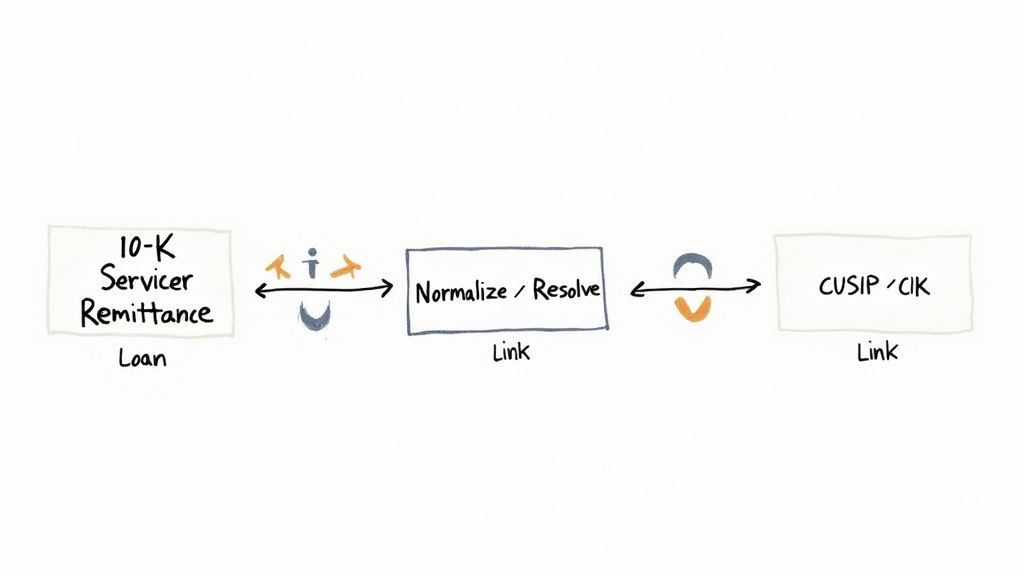
- SEC EDGAR Filings: The 424B5 prospectus contains deal-level metadata, while monthly 10-D filings provide ongoing servicer performance data, often in unstructured XML or plain text.
- Servicer Remittance Reports: Typically delivered as PDFs or CSVs, these reports contain loan-level performance metrics but lack a standardized format, requiring custom parsing logic for each servicer.
- Loan-Level Data Tapes: Large CSV or Excel files provide granular collateral details but require significant reconciliation to link back to specific deals and tranches.
The critical step is entity resolution—the process of identifying and linking disparate identifiers to a single canonical entity. For example, a tranche's CUSIP from a market data feed must be linked to the issuer's CIK from an SEC filing and the deal's name from a prospectus. This explicit mapping of relationships is what distinguishes a knowledge graph from a simple database. The Dealcharts dataset, for example, is built on this principle of linking entities from source filings to create a cohesive graph.
A Programmatic Workflow Example: Parsing a 10-D Filing
To make this concrete, here is a conceptual Python snippet demonstrating how to extract a single data point from a 10-D filing’s XML structure and link it to a deal entity. This highlights the data lineage: source (XML) → transform (parse) → insight (linked data point).
import xml.etree.ElementTree as ETdef extract_loan_count_from_10d(filing_text: str, deal_id: str) -> int | None:"""Parses a 10-D XML to find the total loan count and associates it with a deal entity.NOTE: The actual XML path varies by servicer and filing style."""try:root = ET.fromstring(filing_text)# This XPath is illustrative; a production system needs robust parsers for multiple formats.loan_count_element = root.find('.//LoanSummary/TotalLoanCount')if loan_count_element is not None and loan_count_element.text:loan_count = int(loan_count_element.text)# In a real system, this would be an API call to the knowledge graph:# kg_api.add_fact(# subject=deal_id,# predicate='hasLoanCount',# object=loan_count,# source='10-D Filing',# timestamp='...'# )print(f"Source -> Transform -> Insight: Deal '{deal_id}' has {loan_count} loans as per the 10-D filing.")return loan_countreturn Noneexcept ET.ParseError:print(f"Error: Could not parse XML for deal '{deal_id}'.")return None# --- Example Workflow ---# 1. SOURCE: Fetch the raw 10-D XML filing text for a deal like JPMCC 2021-NQM4.# 2. TRANSFORM: Call the function to parse and extract the specific data point.# 3. INSIGHT: The function returns the structured, linked data point with implicit provenance.
This simple workflow demonstrates the core principle: every piece of data is programmatically extracted and explicitly linked to an entity, creating an explainable data pipeline where every number is verifiable and ready for analysis.
Implications: Model-in-Context and Explainable AI
Structuring financial data as a graph provides the necessary foundation for more sophisticated modeling and AI applications. When every data point is understood through its web of relationships, you achieve a "model-in-context" approach. A loan's delinquency status is no longer an isolated variable but is connected to the property's performance, the servicer's track record, and the borrower's broader financial health.
This connected context is essential for several advanced use cases:
- Enhanced Risk Monitoring: Analysts can traverse the graph to uncover non-obvious concentration risks. For example, a query can instantly reveal all deals exposed to a single tenant who is leasing properties across multiple CMBS transactions, like the BANK 2024-BNK48 deal and the BMARK 2024-V8 transaction.
- Granular Scenario Analysis: Stress tests can be more precise. Instead of applying broad shocks (e.g., "10% decline in office values"), analysts can model the cascading impact of specific events, such as a major tenant defaulting on leases in multiple properties.
- Grounding Large Language Models (LLMs): A knowledge graph acts as a verifiable "context engine" for LLMs. When an analyst asks, "Summarize my portfolio's exposure to hotels serviced by Midland," the LLM can query the graph for precise, source-backed facts, generate an accurate summary, and cite its sources. This mitigates the risk of hallucinations and turns the LLM into a reliable analytical tool. You can read more about how financial institutions are using this tech.
How Dealcharts Helps
Building and maintaining a comprehensive knowledge graph for structured finance is a significant data engineering challenge. Dealcharts abstracts away this complexity by providing a pre-built, verified, and continuously updated graph as a service. Instead of dedicating resources to building data pipelines, your team can immediately access a deeply connected network of deals from the 2024 CMBS vintage, along with their tranches, counterparties, and source regulatory filings. Dealcharts connects these datasets so analysts can publish and share verified charts without rebuilding data pipelines from scratch.
Conclusion
A knowledge graph for structured finance provides the architectural backbone for modern, data-driven analysis. By explicitly mapping the relationships between financial entities and ensuring every data point has a verifiable lineage, it solves the chronic problem of fragmented data. This connected, context-rich foundation enhances risk surveillance, enables more precise modeling, and provides the ground truth required to safely leverage AI. Frameworks like this deliver the reproducible, explainable analytics that the market increasingly demands.
Article created using Outrank