ODPS Standard for Data Products
A Guide to the ODPS Standard for Data Products: Verifiable Lineage in Structured Finance
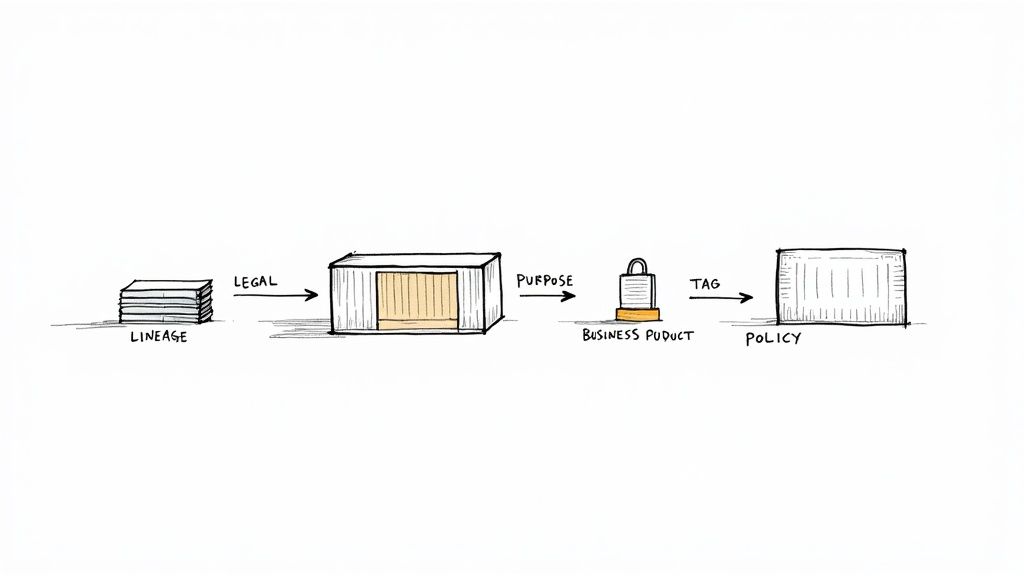
The Open Data Product Specification (ODPS) is less a file format and more a standardized shipping container for data. For structured-finance analysts, data engineers, and quants, it provides a vendor-neutral, machine-readable method for packaging raw information with its essential context: business purpose, technical specifications, legal terms, and verifiable lineage. This guide explains why the ODPS standard for data products matters for programmatic analysis of complex assets like CMBS and ABS. By turning fragmented, context-poor datasets into complete, self-contained assets, it provides a foundation for reproducible modeling and explainable insights. Platforms like Dealcharts use this approach to help analysts visualize and cite verifiable market data.
Market Context: Why Structured Finance Needs a Data Standard
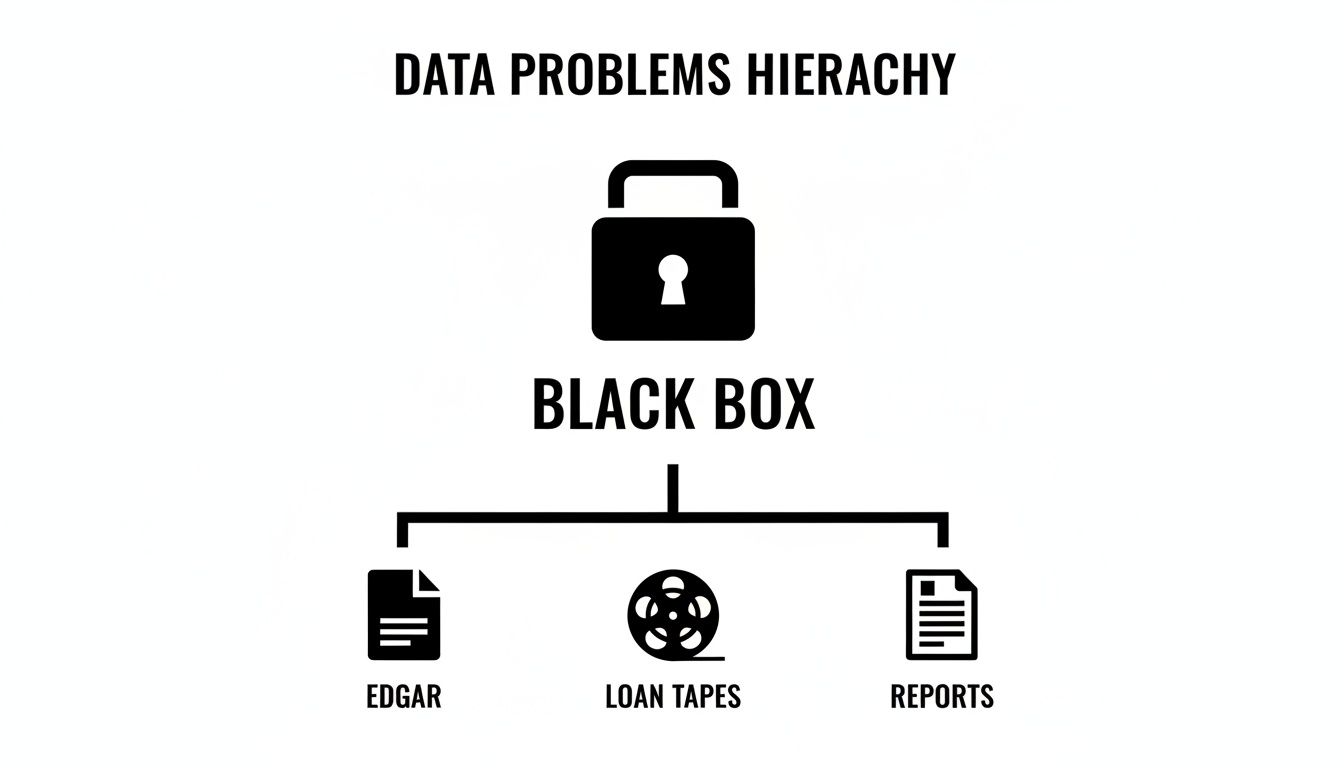
The core challenge in structured finance isn't a lack of data; it's a shortage of trusted data. Analysts and data engineers constantly piece together a mosaic of sources—EDGAR filings, loan tapes, servicer reports—where data lineage and transformations are opaque. This creates analytical black boxes, making it nearly impossible to build reproducible models or confidently verify insights for risk monitoring. Current trends toward automated surveillance and AI-driven analysis amplify this problem, as models built on untraceable data are both unreliable and a significant compliance risk.
The manual, ad-hoc processes that define most data workflows are not auditable or scalable enough to meet modern demands. Without a common language, every team is forced to build custom parsing scripts and linking logic, leading to inefficiency and operational risk.
The Data Angle: Sourcing and Linking Financial Data
Data in structured finance originates from disconnected, often unstructured sources. Key inputs include:
- EDGAR Filings: Monthly performance data from remittance reports (10-D filings) and deal terms from prospectuses (424B5 filings) are foundational but require brittle, deal-specific parsing scripts.
- Loan Tapes: Initial loan-level data often arrives in inconsistent Excel or CSV formats, demanding hours of manual cleaning and normalization.
- Servicer Reports: These PDFs contain crucial commentary on loan modifications or property-level events but are nearly impossible to integrate into quantitative models programmatically.
The ODPS standard for data products provides a framework to tame this chaos. By defining a common specification, it forces producers to package data with machine-readable metadata that describes its origin, schema, quality rules, and ownership. This structure makes it possible for analysts and developers to programmatically access, parse, and link datasets with confidence. For example, an analyst could reliably join remittance data from a 2024 CMBS vintage with its original prospectus terms because both datasets are described using a consistent, verifiable standard.
Example Workflow: Creating an ODPS-Compliant Data Product from EDGAR Filings
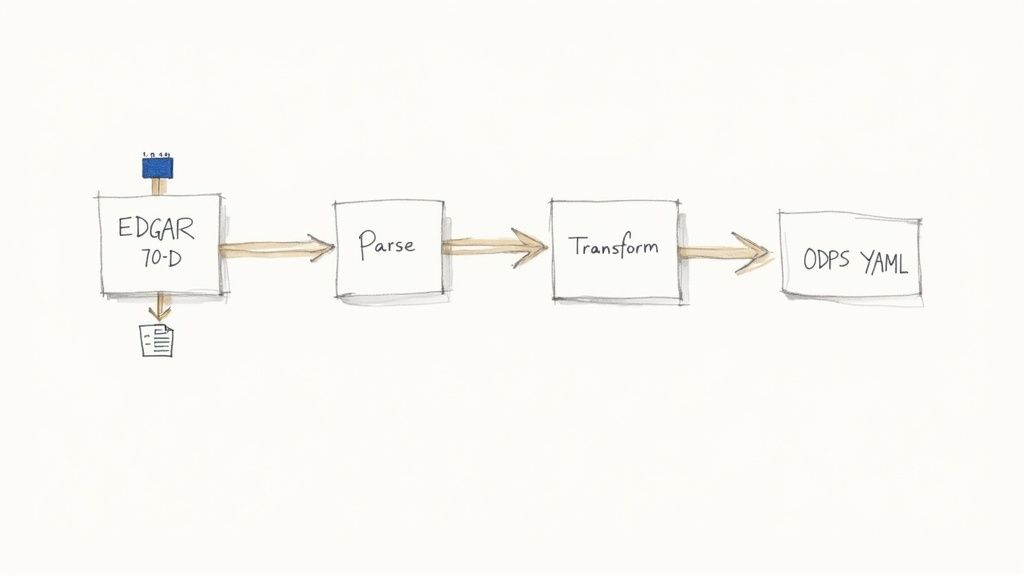
This example demonstrates a programmatic workflow for creating a data product from EDGAR 10-D filings, highlighting the data lineage from source to insight.
1. Source the Raw Data: The process begins with raw, unstructured source documents. For an auto ABS deal like World Omni Auto Receivables Trust 2024-A, the source is a series of monthly 10-D filings from EDGAR. These documents contain performance metrics buried in XML or HTML tables.
2. Define Transformation Logic: Next, we define the logic to extract and structure the information. This is the crucial "transform" step in establishing data lineage. A Python script would parse each 10-D, locate tables with delinquency buckets (e.g., 30-59 days, 60-89 days), extract principal balances for each category, and calculate a derived metric like the 60+ day delinquency rate. This logic is explicit and repeatable.
3. Create the ODPS YAML Manifest: Finally, the transformed data is packaged as an ODPS-compliant product by creating a YAML manifest. This file acts as the data's "nutritional label," making the entire workflow transparent and machine-readable. It contains metadata about the data's origin, structure, and purpose.
Here is a Python snippet showing the calculation and subsequent ODPS YAML definition:
# Fictional data representing parsed EDGAR 10-D valuestotal_pool_balance = 1_000_000_000delinquency_60_89_days = 15_000_000delinquency_90_plus_days = 5_000_000# Step 2: Calculate the derived metricdq_60_plus_balance = delinquency_60_89_days + delinquency_90_plus_daysdq_60_plus_rate = (dq_60_plus_balance / total_pool_balance) * 100# Step 3: Structure the ODPS YAML outputodps_yaml = f"""id: urn:dealcharts:abs:auto:woart-2024-a:remittance:v1name: "WOART 2024-A 60+ Day Delinquency Rate"description: "Calculates the 60+ day delinquency rate from monthly 10-D filings."owner: "ABS Surveillance Team"version: "1.0.0"useCases:- "Monthly credit risk monitoring"- "Input for prepayment and default models"schema:fields:- name: "report_date"type: "date"- name: "dq_60_plus_rate"type: "decimal"description: "Sum of 60-89 and 90+ day delinquencies as a percentage of total pool balance.""""print(odps_yaml)
This process transforms an opaque data source into a transparent, verifiable asset with clear lineage, ready for reliable use in models and systems.
Insights and Implications for Modeling and AI
Adopting a standard like ODPS improves modeling, risk monitoring, and LLM reasoning by embedding context directly with data. When every dataset arrives with a machine-readable specification, analytical models become more accurate and resilient. An analyst building a prepayment model can programmatically verify data freshness via the SLA component and understand quality constraints from the schema, eliminating flawed assumptions.
This is particularly transformative for AI and Large Language Models (LLMs). LLMs are powerful but require structured context to reason accurately about financial data. Feeding an LLM an ODPS-defined data product provides the narrative it needs to understand the data's business purpose, limitations, and connections. This structured context elevates an LLM from simple data retrieval to performing complex analysis—like comparing delinquency trends across different vintages—with greater accuracy and explainability. This aligns with the CMD+RVL vision of creating "model-in-context" systems and "explainable pipelines" where every output is traceable to its source.
How Dealcharts Helps
Dealcharts connects these disparate datasets—filings, deals, shelves, tranches, and counterparties—so analysts can publish and share verified charts without rebuilding data pipelines. By adhering to an ODPS-like structure, every visualization on https://dealcharts.org provides baked-in lineage, context, and citability. You can trace an insight back to its source document with a single click, as seen in deals like the BMARK 2024-V7 CMBS issuance. This makes financial analytics reproducible, explainable, and trustworthy.
Conclusion
The ODPS standard for data products provides a crucial framework for bringing trust, clarity, and reproducibility to structured finance analytics. By treating data as a product with verifiable lineage and embedded context, analysts and engineers can build more resilient models, automate complex workflows, and unlock more reliable insights. This data-centric approach, foundational to frameworks like CMD+RVL, enables the explainable, programmatic analysis required in modern capital markets.
Article created using Outrank