Real Estate NAV Calculation Guide
How to Programmatically Calculate Real Estate Net Asset Value
For structured-finance analysts and data engineers, calculating real estate net asset value (NAV) is a foundational workflow. It represents the market value of a property portfolio minus all liabilities—the true equity value. But in programmatic analysis, NAV is more than a number; it's the output of a data pipeline that must be transparent, verifiable, and reproducible. A defensible NAV is critical for everything from underwriting new CMBS deals to monitoring portfolio risk and even providing context for LLM-based financial analysis. For professionals using platforms like Dealcharts to visualize market data, understanding the lineage of NAV is non-negotiable.
Market Context: Why NAV is a Critical Metric in CMBS and Credit Markets
In the commercial mortgage-backed securities (CMBS) market, NAV is the ultimate measure of collateral health. It directly informs the loan-to-value (LTV) ratio, a key indicator of credit risk. A declining NAV erodes the equity buffer protecting bondholders, signaling potential defaults long before loan payments are missed.
Current market volatility, driven by interest rate shifts, has intensified the focus on NAV. As borrowing costs rise, capitalization rates expand, putting downward pressure on property valuations. This creates significant challenges for analysts:
- Data Lag: Private asset valuations are often updated quarterly, creating a dangerous gap between reported values and real-time market conditions. A public REIT's value changes by the second, but a private portfolio's NAV might be stale.
- Refinancing Risk: For loans approaching maturity, a lower NAV combined with higher financing costs creates a refinancing bottleneck, elevating default probabilities across portfolios.
- Technical Fragmentation: The data required to calculate an accurate, up-to-date NAV is scattered across disparate sources, making programmatic analysis a significant technical hurdle.
For analysts monitoring recent CMBS vintages, the ability to dynamically recalculate NAV using fresh market inputs is essential for accurate risk surveillance.
The Data & Technical Angle: Sourcing and Linking NAV Inputs
A robust, programmatic real estate net asset value calculation depends on a clear and verifiable data lineage. The core challenge for data engineers and quants is to systematically access, parse, and link data from multiple, often unstructured, sources.
The essential data points are typically found in:
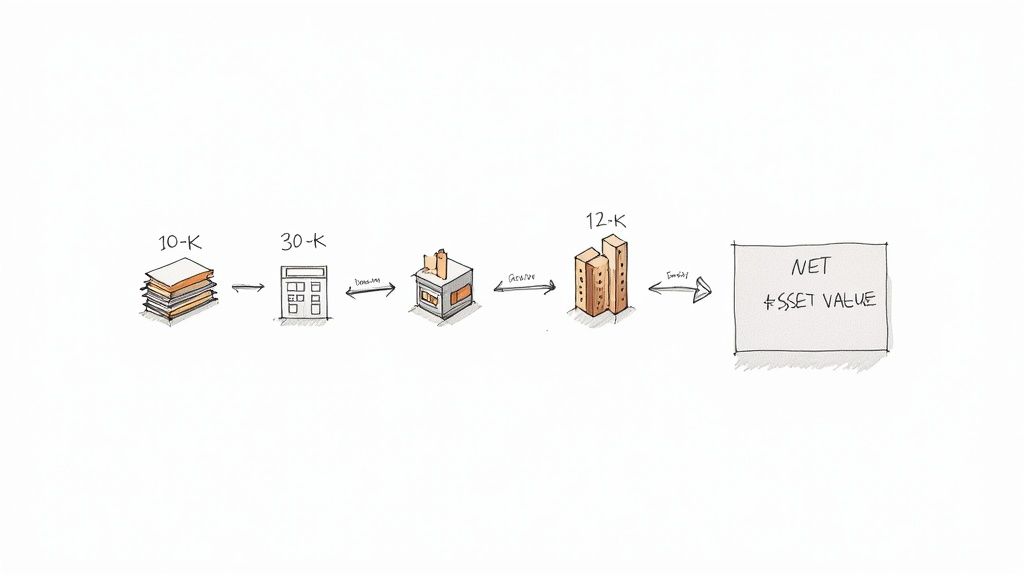
- SEC Filings: Property-level financials like Net Operating Income (NOI) are often detailed in servicer reports filed as EDGAR 10-D exhibits. Balance sheet data for REITs comes from 10-K filings, and original underwriting assumptions are found in 424B5 prospectuses.
- Loan-Level Tapes: Servicers provide detailed data tapes containing property performance metrics, current loan balances, and other critical inputs.
- Third-Party Market Data: Cap rates, vacancy rates, and sales comps are sourced from commercial real estate data providers.
Linking these sources is key. An analyst needs to connect a specific property mentioned in a 10-D filing back to the original loan in the CMBS trust's prospectus and then overlay current market data. This requires mapping identifiers like property IDs, loan numbers, and even entity CIKs to build a coherent picture. Without a structured data platform, this is a manual, error-prone process that cripples any attempt at scalable, real-time analysis.
Example: A Python Workflow for Calculating Market NAV
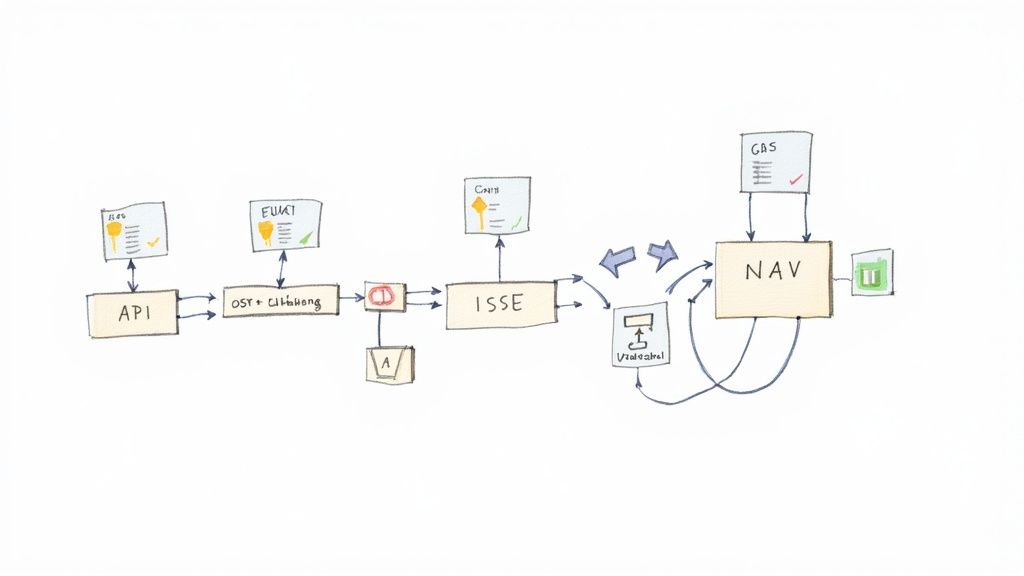
Let's demonstrate a simplified programmatic workflow. This Python snippet shows how an analyst could calculate Market NAV for a portfolio, highlighting the data lineage from source inputs to a final, explainable insight. The key is that every step is codified, making the entire calculation transparent and reproducible.
import pandas as pd# Step 1: Ingest Source Data (e.g., from an API or parsed 10-D filing)# Data lineage: Raw inputs sourced from servicer reports or a structured data feed.property_data = {'property_id': ['PropA', 'PropB', 'PropC'],'net_operating_income': [500000, 750000, 1200000], # Source: Most recent 10-D'mortgage_debt': [4500000, 6000000, 10000000], # Source: Loan Tape'other_liabilities': [200000, 300000, 500000] # Source: 10-K Filing}portfolio_df = pd.DataFrame(property_data)# Step 2: Define Valuation Assumptions# Data lineage: Market cap rate sourced from a third-party data provider.market_cap_rate = 0.065 # 6.5% capitalization ratetotal_shares_outstanding = 1000000# Step 3: Transform Data - Calculate Estimated Market Value# Logic: Market Value = Net Operating Income / Capitalization Rateportfolio_df['estimated_market_value'] = portfolio_df['net_operating_income'] / market_cap_rate# Step 4: Aggregate Portfolio Values and Liabilitiesportfolio_df['total_liabilities'] = portfolio_df['mortgage_debt'] + portfolio_df['other_liabilities']total_market_value = portfolio_df['estimated_market_value'].sum()total_liabilities = portfolio_df['total_liabilities'].sum()# Step 5: Derive Insight - Calculate Portfolio NAV and NAV per Shareportfolio_nav = total_market_value - total_liabilitiesnav_per_share = portfolio_nav / total_shares_outstanding# Step 6: Output the Verifiable Resultprint(f"Data Source: Servicer Reports (10-D), Loan Tapes, Market Data")print(f"Total Portfolio Market Value: ${total_market_value:,.2f}")print(f"Total Portfolio Liabilities: ${total_liabilities:,.2f}")print("---")print(f"**Total Portfolio Net Asset Value (NAV): ${portfolio_nav:,.2f}**")print(f"**NAV per Share: ${nav_per_share:,.2f}**")
This script transforms raw data points from specified sources into a meaningful financial metric. An analyst, regulator, or AI model can trace the logic from the initial NOI figure to the final NAV, ensuring complete explainability. You can see how this plays out in real deals like the BANK5 2024-5YR5 CMBS transaction.
Insights and Implications for Advanced Analytics
Adopting a programmatic, data-lineage-first approach to NAV calculation has profound implications. It improves modeling accuracy, enhances risk monitoring, and provides the structured context required for advanced applications like Large Language Models (LLMs).
An LLM tasked with summarizing risk for a CMBS pool cannot reason effectively from a PDF. However, if it can access a knowledge graph where properties are linked to their financials, debt, and market comps—with a clear audit trail for each data point—it can generate trustworthy, context-aware insights. This is the core idea behind "model-in-context." An analytical model, whether a traditional discounted cash flow (DCF) or a complex AI, is only as reliable as the structured, verifiable data it consumes. Building explainable data pipelines is the foundation for next-generation financial analytics, moving beyond opaque "black box" models to auditable, defensible workflows.
How Dealcharts Helps
Dealcharts connects these disparate datasets—filings, deals, shelves, tranches, and counterparties—so analysts can publish and share verified charts without rebuilding data pipelines from scratch. By providing structured, linkable data from sources like SEC filings and servicer reports, Dealcharts allows you to focus on analysis rather than data plumbing. The platform is designed to support the kind of transparent, programmatic workflows needed to calculate metrics like real estate net asset value with confidence and precision.
Conclusion
Calculating real estate net asset value is fundamentally a data engineering challenge. The accuracy and defensibility of the final number rest entirely on the quality and transparency of the underlying data pipeline. By building programmatic workflows with clear data lineage, financial analysts and data scientists can create scalable, auditable models that power more intelligent risk management and investment decisions. This approach, which emphasizes data context and explainability, is the cornerstone of the modern, reproducible finance analytics championed by frameworks like CMD+RVL.
Getting the Inputs and Adjustments Right
A real estate net asset value calculation is only as good as the numbers you feed it. A truly defensible model has a clear, verifiable story for every single assumption, from cap rates down to capex reserves. The global real estate market is on track to hit a mind-boggling $654.39 trillion by 2025, according to a global real estate forecast on Statista. With that much capital in play, getting the valuation right isn't just important—it's everything.
As you dive into the research needed for precise inputs, knowing how to effectively summarize research papers can seriously speed up your analysis.
-
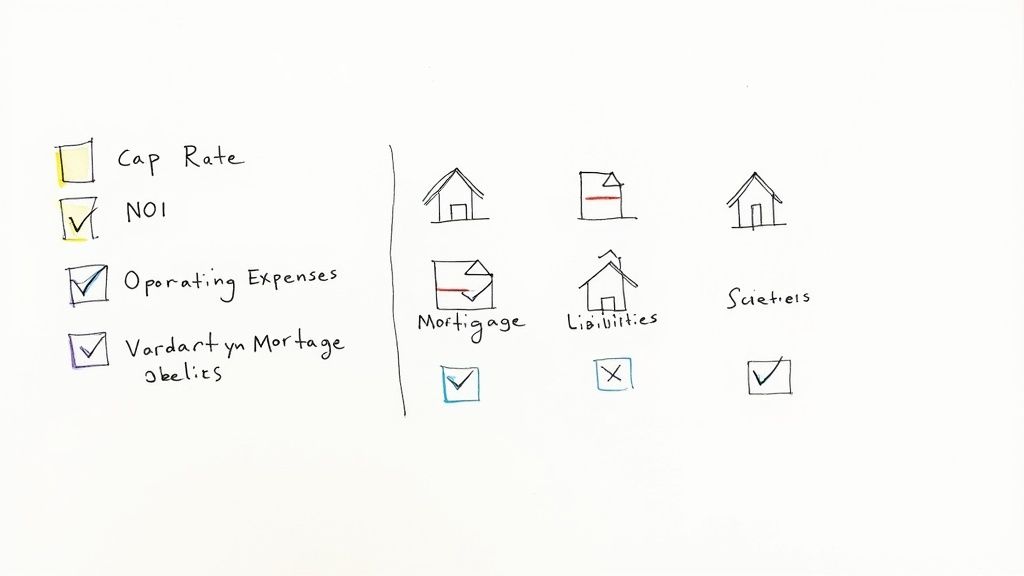
Capitalization Rates (Cap Rates): These aren't static numbers. They reflect market sentiment, interest rate moves, and asset-specific risk. A common error is applying a national average cap rate to a niche property. Best practice involves programmatically sourcing cap rates from servicer reports or third-party data providers that reflect the specific submarket.
-
Vacancy Rates and Credit Loss: A forward-looking vacancy assumption based on market trends is essential. This buffer provides a more realistic picture of future income than a simple review of the current rent roll.
-
Operating Expense Ratios: Historical operating statements are a starting point. Non-recurring expenses must be identified and removed, and realistic assumptions for future cost growth (e.g., property taxes, insurance) must be included.
-
Liabilities and Capital Adjustments: Subtracting debt requires more than just the current mortgage balance. Unfunded tenant improvements (TIs), leasing commissions, and deferred maintenance are real liabilities that must be accounted for. For deals like the 3650 REIT 2022-PF2 transaction, these details are critical.
Article created using Outrank