Risk Management Securities
Mastering Risk Management Securities for Programmatic Analysis
Properly executing risk management securities analysis in modern finance is a data-intensive discipline for spotting, measuring, and handling the interconnected threats within structured finance deals. For professionals in asset-backed securities (ABS) or commercial mortgage-backed securities (CMBS), programmatic analysis is no longer optional—it's a critical capability for protecting capital and identifying mispriced risk. This guide breaks down the data, workflows, and context required for building verifiable, model-ready insights, which you can visualize and cite using platforms like Dealcharts.
Market Context: The Shift to Data-Driven Surveillance
The era of static, spreadsheet-based risk management is over. It's an approach that fails to capture the dynamic interplay of credit, prepayment, and liquidity risks defining complex securities. For structured-finance analysts, quants, and data engineers, this reality necessitates a move toward programmatic workflows that can trace data from source to insight.
The 2008 financial crisis serves as a stark reminder of the consequences of inadequate risk models. With US private-label MBS issuance hitting $1.2 trillion in 2006, often backed by thin historical data, the subsequent $2.7 trillion in global credit losses prompted a regulatory overhaul. Data on deals from that period, like these CMBS deals from the 2008 vintage, still offers valuable lessons.
The post-crisis landscape, shaped by Basel III and the Volcker Rule, pushed significant risk from banks to nonbank financial institutions (NBFIs), which now hold nearly half of all global financial assets. This shift underscores a critical point: understanding deal structures, waterfalls, and counterparty dependencies is central to identifying tail risk. It demands a verifiable data lineage—tracing every number from its origin in a 10-D filing, through transformations, to the final risk metric. This approach turns risk management from a defensive function into a strategic advantage. For a deeper dive, see the full IMF research on global financial stability.
Data and Technical Angles for Risk Management Securities
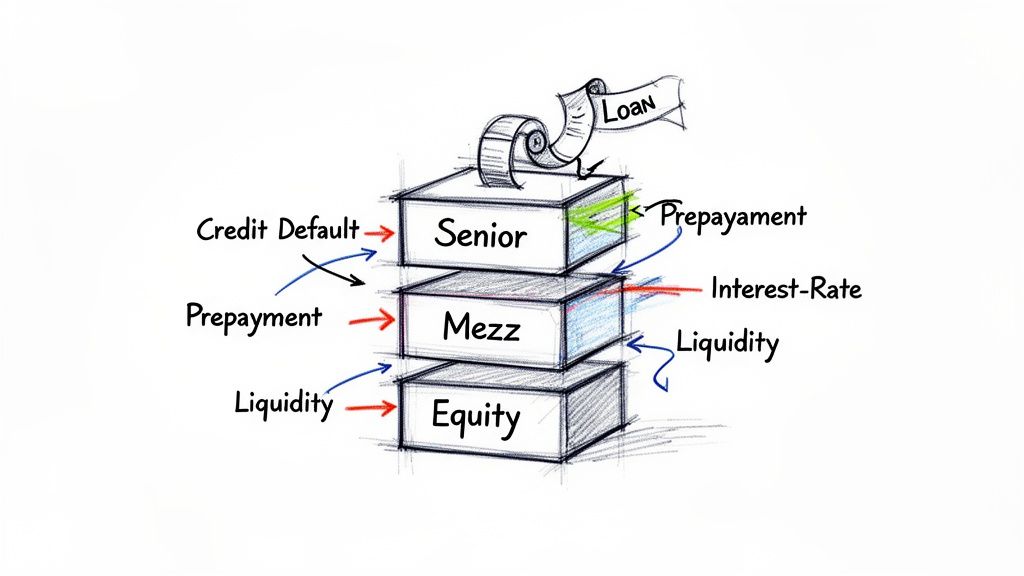
Effective risk management securities analysis depends on accessing, parsing, and linking disparate data sources into a coherent whole. These are not isolated threats but interdependent forces whose effects propagate through a deal's capital stack. A practical, data-first understanding of these components is essential for any quantitative analysis.
The primary sources for structured finance data are public regulatory filings, which provide the ground truth for performance monitoring.
- Loan-Level Tapes: Often provided at issuance, these datasets offer granular detail on every asset in the collateral pool—the foundation for initial credit assessment.
- Servicer Reports (10-D Filings): Filed monthly with the SEC, these reports contain remittance data detailing collections, delinquencies, defaults, prepayments, and losses. This is the lifeblood of ongoing surveillance.
- Prospectuses (424B5 Filings): The deal's blueprint, outlining the capital structure, waterfall rules, credit enhancement levels, and performance triggers that govern cash and loss distribution.
The technical challenge lies in connecting these sources. A programmatic workflow must link a tranche's CUSIP to its parent deal's CIK, which in turn connects to a time-series of 10-D filings available via the SEC's EDGAR system. This creates a structured, auditable data graph—a prerequisite for reliable modeling. Platforms like Dealcharts automate this linkage, connecting filings to deals and tranches programmatically.
Table: Key Risk Types in Structured Securities
| Risk Category | Primary Driver | Impact on Tranches | Example Scenario |
|---|---|---|---|
| Credit Risk | Borrower defaults on underlying loans | Losses absorbed first by equity and junior tranches, protecting senior tranches | An economic downturn causes widespread job losses, leading to a 15% increase in auto loan defaults in an ABS pool. |
| Prepayment Risk | Borrowers paying off loans early | IO tranches lose value as interest stream shrinks; PO tranches gain value from faster principal return | The central bank cuts interest rates by 100 bps, triggering a wave of mortgage refinancing in an RMBS pool. |
| Interest-Rate Risk | Changes in market interest rates (e.g., SOFR) | Floating-rate tranches see coupon payments change; fixed-rate tranches see market price fluctuate | A sudden spike in inflation forces the central bank to raise rates, causing the market value of existing fixed-rate bonds to fall. |
| Liquidity Risk | Market stress or lack of buyers for a specific security | Hard to sell without a major price drop, especially for mezzanine/junior tranches | A credit crisis freezes the secondary market, making it nearly impossible to find a buyer for a B-rated CMBS tranche. |
Example Workflow: Programmatic Risk Analysis
Static reports are insufficient for modern risk surveillance. An effective workflow is programmatic, dynamic, and repeatable, ensuring every insight is traceable to its source document. This data lineage mindset is crucial for building trust in analytical outputs.
Building a Verifiable Data Pipeline
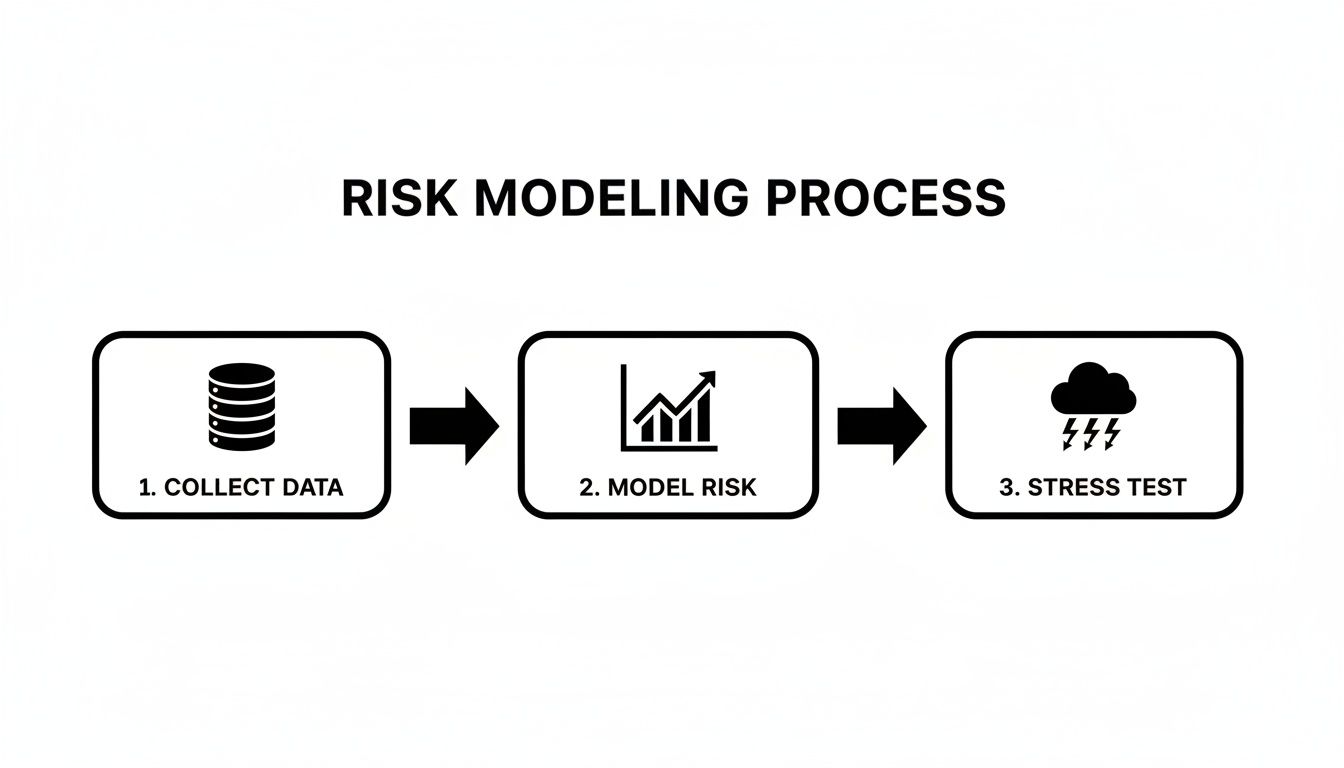
A transparent data pipeline follows a clear path: source → transform → insight. The goal is to automate the extraction and structuring of data from regulatory filings.
The process begins by programmatically accessing filings from the SEC EDGAR database. Using a script, an analyst can fetch all 10-D filings for a specific CMBS issuer, parse the XML or XBRL attachments to extract key performance indicators (e.g., delinquency buckets, net losses), and load them into a structured format for time-series analysis.
Here is a conceptual Python snippet demonstrating the first step: fetching filing metadata for an issuer.
import requests# Define the CIK for a specific ABS issuer (J.P. Morgan Chase Commercial Mortgage Securities Trust 2019-MORT)# CIK must be 10 digits, padded with leading zerosCIK = "0001789221"# Set a User-Agent as required by the SEC EDGAR APIheaders = {'User-Agent': 'YourName YourEmail@example.com'}# Construct the URL for the SEC EDGAR submissions APIapi_url = f"https://data.sec.gov/submissions/CIK{CIK}.json"try:# Fetch the JSON data containing all filings for the CIKresponse = requests.get(api_url, headers=headers)response.raise_for_status() # Raise an exception for bad status codes (4xx or 5xx)# Parse the JSON responsefilings_data = response.json()# Example: Extract the accession number of the most recent filingrecent_filings = filings_data.get('filings', {}).get('recent', {})if recent_filings.get('accessionNumber'):latest_accession_num = recent_filings['accessionNumber'][0]print(f"Successfully fetched data for CIK: {CIK}")print(f"Most recent filing accession number: {latest_accession_num}")else:print("No recent filings found.")except requests.exceptions.RequestException as e:print(f"An error occurred: {e}")
This script automates the tedious task of data collection and serves as a self-documenting audit trail. The code itself explains the data's origin, making the entire analysis reproducible and defensible. From here, further logic would parse the specific XML/XBRL files associated with each accession number to extract remittance data for surveillance and modeling. You can review performance metrics derived from such data on interactive charts, like this one for the 3650R 2022-PF2 deal. For deeper insights on risk management trends, see the full risk management statistics and their implications.
Implications: Building Context for Models and AI
The value of a programmatic, data-lineage-centric workflow extends beyond efficiency. It provides the structured context necessary for advanced analytics, machine learning models, and LLM-based reasoning. An AI's output is only as reliable as the data it's trained on. Without a verifiable data graph, insights remain trapped in a "black box," untrustworthy for critical investment decisions.
This is the core idea behind a "model-in-context" framework. By linking a CUSIP to its deal, issuer shelf (e.g., J.P. Morgan Chase Commercial Mortgage Securities Trust), and a full history of public filings, we create an explainable pipeline. This structure transforms risk analysis from a retrospective reporting function into a forward-looking, automated surveillance capability.
AI models trained on such connected data can perform sophisticated tasks, like comparing performance triggers across an entire vintage of CMBS deals or identifying correlated counterparty risk. As risk managers increasingly place AI at the core of their strategy, the demand for open, attribution-ready datasets will only grow. This shift is detailed in summaries of critical risk management trends reshaping the industry.
How Dealcharts Helps
Dealcharts connects these datasets—filings, deals, shelves, tranches, and counterparties—so analysts can publish and share verified charts without rebuilding data pipelines. Our platform provides the structured, citation-ready foundation needed to build programmatic workflows, enabling users to focus on generating insights rather than wrestling with data extraction and linkage. By providing transparent, open data, we empower analysts to build risk models and surveillance systems that are both powerful and fully auditable.
Conclusion
The future of risk management for securities lies in building programmatic, verifiable, and explainable workflows. This approach moves beyond simple compliance to create a strategic advantage through reproducible finance. By grounding every analysis in a transparent, interconnected data graph, teams can empower analysts, models, and AI systems to work from a shared, verifiable understanding of market dynamics. This is the foundation for the broader CMD+RVL vision of a more resilient, intelligent, and trustworthy financial ecosystem.
Key Takeaways
- Data Lineage is Non-Negotiable: Every risk metric must be traceable to its source document (e.g., 10-D, 424B5 filings) from the SEC's EDGAR database.
- Programmatic Workflows are Essential: Automating data extraction and parsing via APIs creates reproducible and auditable surveillance systems.
- Context Powers AI: A structured data graph linking securities, issuers, and filings provides the necessary context for reliable AI-driven insights and "model-in-context" analysis.
Ready to build risk analyses you can trust? Explore the platform at https://dealcharts.org.
Article created using Outrank