What Is a CMBS?
What Is a CMBS? A Data-Driven Guide to Commercial Mortgage-Backed Securities
So, what is a CMBS? A Commercial Mortgage-Backed Security is a financial instrument created by pooling hundreds of commercial real estate loans—mortgages on office buildings, retail centers, or hotels—and transforming them into a single, tradable bond. This process, known as securitization, converts illiquid commercial mortgages into liquid securities that can be bought and sold on public markets. For structured-finance analysts and data engineers, a CMBS is more than a bond; it's a rich, verifiable data ecosystem built on public filings like servicer reports and loan-level remittance data. Understanding its structure is key to programmatic analysis and risk monitoring. This guide breaks down the data lineage behind these complex securities, from SEC filings to model-ready insights, which you can visualize on Dealcharts.
Market Context: Why CMBS Data Lineage Matters
Commercial Mortgage-Backed Securities (CMBS) are a cornerstone of the structured finance world, providing essential liquidity to the commercial real estate (CRE) market. For analysts, they offer direct exposure to CRE performance, but their complexity demands a rigorous, data-first approach. The entire securitization process generates a verifiable data trail for every underlying loan, from origination to payoff.
Following this data lineage is critical for credible CMBS analysis. The market's health directly reflects broader economic trends and lender risk appetite. For instance, private-label CMBS issuance has seen significant shifts, with market activity often compared to the pre-crisis peak in 2007 when issuance reached $230.5 billion. Tracking these trends requires verifiable data sources, like those aggregated by market data providers like Trepp.com.
The key challenge for analysts and data engineers is not a lack of data, but its fragmentation across different filings and formats. Each deal involves multiple parties leaving distinct data footprints:
- Borrowers: Property owners taking out loans.
- Lenders: Banks originating the mortgages.
- Issuers: Investment banks packaging loans into securities.
- Servicers: Companies managing loan payments and workouts.
- Investors: Institutions buying the bond tranches.
Every action is documented in public filings like prospectuses and servicer reports. For quants and developers, this is the raw material for building models to forecast performance, assess risk, and identify opportunities. The competitive edge today comes from the ability to programmatically access, parse, and link this information, building a verifiable chain from source document to analytical insight—a principle we apply to cross-deal analytics for the 2024 CMBS vintage.
The Technical Angle: Sourcing Verifiable CMBS Data
To move from concept to analysis, you must understand where CMBS data originates and how to access it programmatically. The entire CMBS universe is built on a foundation of legal and financial documents that create a clear, auditable trail. These are not just compliance filings; they are the architectural blueprints and real-time performance logs for every deal.
Core Data Sources and SEC Filings
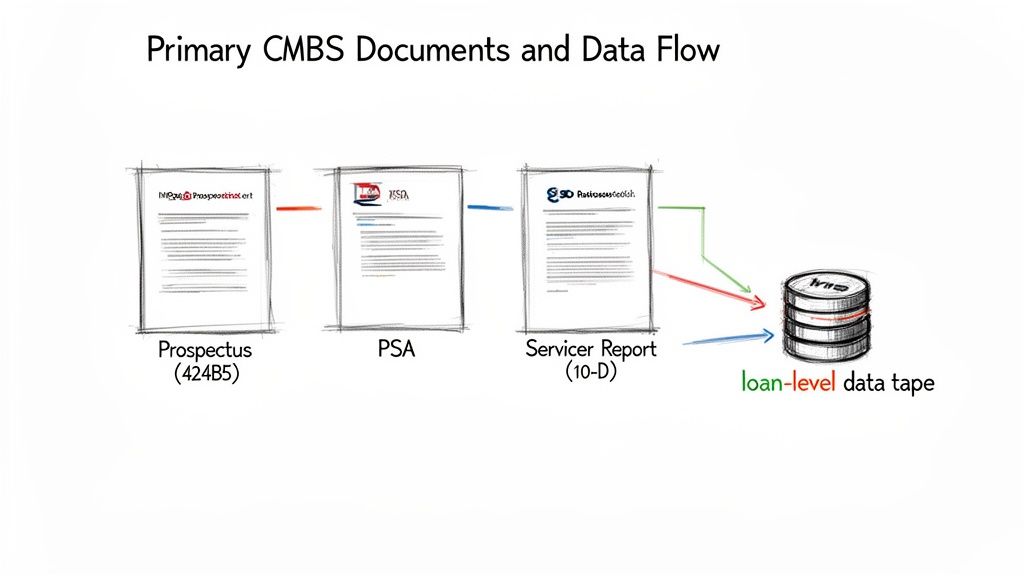
Every CMBS transaction is defined by a few key documents filed with the SEC. Mastery of these sources is the first step in building a robust data pipeline.
- The Prospectus (Form 424B5): This is the deal's originating document. It details the entire structure, describes the initial loan pool, explains the payment waterfall, and discloses all identified risks. It is the primary source for understanding a deal's intended collateral and structure.
- The Pooling and Servicing Agreement (PSA): This is the legal rulebook for the trust. This lengthy document governs everything from cash flow distributions to the specific duties of the master and special servicers. It dictates the mechanics of the deal in both performing and distressed scenarios.
- Servicer and Trustee Reports (Form 10-D): These are the monthly performance updates. Filed throughout the deal's life, these reports contain the servicer's remittance data. The loan-level data tapes—the most granular source of performance information—are found in the exhibits of these 10-D filings.
From Document to Data Pipeline
The real technical work begins when you stop reading these documents and start programmatically extracting structured data from them. The primary target is the loan-level tape—a detailed table with dozens of columns for every mortgage in the pool.
The process typically involves querying the SEC's EDGAR database for the latest 10-D filings, identifying the correct exhibits, and parsing them into a usable format. Given that many trustee reports are PDFs, automating the process of extracting tables from PDF files is a common challenge for developers.
Programmatic access to these source documents is what separates modern quantitative analysis from traditional methods. It creates a repeatable and verifiable workflow, ensuring every data point in a model can be traced back to a citable SEC filing.
Once parsed, this data fuels all subsequent analysis, from calculating pool-wide metrics like DSCR and LTV to monitoring specific properties showing signs of distress. For example, by ingesting the monthly remittance data for a deal like MSC 2021-L5, you can build a time-series view of its underlying collateral performance. This data-first approach bridges the gap between a deal's legal structure and its real-world financial performance.
Example Workflow: Programmatic CMBS Performance Analysis
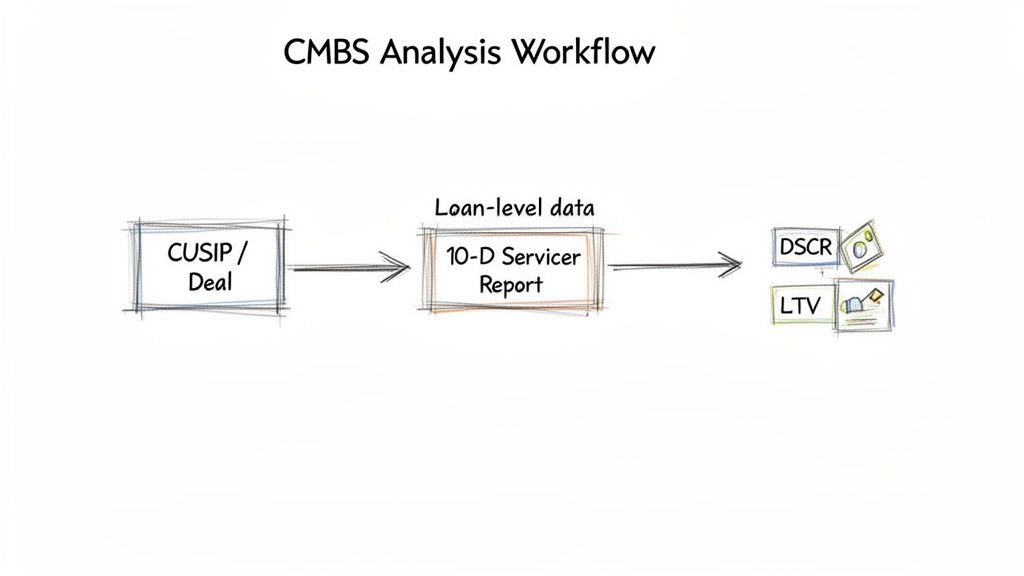
Theory is one thing; practical application is another. Let's walk through a typical workflow for a data engineer or quant, tracing data from a deal identifier down to a verifiable, loan-level insight. This data-centric process truly defines what a CMBS is in an analytical context.
The workflow begins with a deal identifier, such as a CUSIP or deal name. The objective is to assess the current credit health of the underlying loan pool. This requires sourcing the latest servicer report, typically found as an exhibit within a monthly 10-D filing on the SEC's EDGAR database.
Sourcing and Parsing with Python
First, find and download the filing. The critical component is the remittance data, or loan-level tape—a table detailing every mortgage in the pool. It contains dozens of fields: current loan balance, payment status, net operating income (NOI), and property occupancy. This is ground-truth data.
Parsing these tapes is notoriously difficult due to inconsistent formatting (CSV, XML, structured text in PDFs). A Python script using libraries like
and a PDF parsing tool is essential for cleaning and structuring this data.pandas
Here is a simplified Python snippet demonstrating how to calculate a key metric once the data is in a pandas DataFrame.
import pandas as pdimport numpy as np# Assume 'df' is a pandas DataFrame loaded from a parsed loan-level tape# It must contain 'net_operating_income', 'total_debt_service', and 'current_balance' columnsdef calculate_weighted_avg_dscr(df: pd.DataFrame) -> float:"""Calculates the weighted-average DSCR for a loan pool."""# Filter out rows with invalid or zero debt service to avoid division errorsvalid_loans = df[df['total_debt_service'] > 0].copy()if valid_loans.empty:return 0.0# Calculate DSCR for each individual loanvalid_loans['dscr'] = valid_loans['net_operating_income'] / valid_loans['total_debt_service']# Calculate the weighted average DSCR, weighted by the current loan balanceweighted_avg_dscr = np.average(valid_loans['dscr'], weights=valid_loans['current_balance'])return weighted_avg_dscr# Example Usage:# loan_tape_df = pd.read_csv('parsed_remittance_data.csv')# pool_dscr = calculate_weighted_avg_dscr(loan_tape_df)# print(f"Weighted Average DSCR: {pool_dscr:.2f}x")
Source → Transform → Insight: This script takes raw data fields from a servicer report (
,net_operating_income
), transforms them by calculating a per-loan ratio, and derives a verifiable insight (the pool's weighted-average DSCR).total_debt_service
Key Performance Metrics
Two of the most critical metrics are the Debt Service Coverage Ratio (DSCR) and the Loan-to-Value (LTV) ratio.
- Weighted Average DSCR: The go-to metric for cash flow health. It measures if the properties are generating enough collective income to cover their mortgage payments. A DSCR below 1.0x is a major red flag.
- Weighted Average LTV: This ratio measures leverage by comparing the total loan balance to the most recent appraised property values. Rising LTV suggests falling property values or increased loan risk.
This entire process creates an explainable data pipeline. Every derived metric can be programmatically traced back to a specific value in a citable public document, which is non-negotiable for building credible financial models and institutional-grade analytics.
Insights and Implications: Building Context Engines for Finance
Standard performance metrics provide a snapshot, but true analytical alpha comes from connecting disparate datasets. By linking deal filings, property performance, servicer actions, and counterparty histories, we build a context engine. This allows an analyst to move beyond observing that a loan's DSCR changed and instead understand why by linking it to a specific servicer comment in a 10-D filing or a shift in local market data.
This "model-in-context" approach is critical for grounding AI and Large Language Models (LLMs) in financial reality. An LLM, by itself, lacks a concept of financial truth and can "hallucinate" incorrect information. A context engine anchors its reasoning to a verifiable graph of citable sources. When an AI's analysis is tied to auditable data lineage—linking a loan modification to a specific PSA clause—its outputs become trustworthy and, most importantly, explainable. This approach is central to advancing the use of AI for financial analysis.
This marks a shift toward explainable pipelines, where the quality and interconnectedness of data are as important as the algorithms themselves. CMBS is an ideal domain for this, as its data, while fragmented, is public and follows a regulated structure. By building models on a foundation of verifiable, interconnected data, analysts can generate risk assessments that are not only more accurate but also fully defensible.
How Dealcharts Helps
The process of manually building and maintaining data pipelines to connect filings, deals, shelves, tranches, and counterparties is slow, error-prone, and distracts from core analysis. The old way of working forces analysts to spend more time on data plumbing than on generating insights.
Dealcharts connects these datasets into a navigable, open context graph built on public filings and open data standards. This lets analysts publish and share verified charts without rebuilding data pipelines from scratch. Instead of wrestling with fragmented sources, you can trace every data point back to its origin, making your analysis transparent, reproducible, and defensible. This allows you to focus on what matters: turning verifiable data into actionable financial insights.
Conclusion: Data Context and Explainability
In structured finance, understanding what a CMBS is requires moving beyond textbook definitions to embrace a data-first mindset. The value lies not just in the security itself, but in the rich, auditable data trail it produces. By building explainable pipelines that trace data from source filings to analytical insights, analysts and quants can create more robust models, improve risk monitoring, and ground advanced AI in verifiable fact. This focus on data lineage and context is the foundation of reproducible, explainable finance analytics, a core principle of the CMD+RVL framework.
Dealcharts helps you connect the dots between the deals, the SEC filings, the servicers, and all the performance data. We turn a messy pile of information into a clear, verifiable picture. Start exploring CMBS deals and tracing the data yourself over at https://dealcharts.org.
Article created using Outrank