Understanding Cap Rates
What Is Capitalization Rate in Real Estate?
The capitalization rate, or cap rate, is a fundamental metric in commercial real estate analysis. It measures a property's potential rate of return based on its expected income. The cap rate represents the unlevered annual return on an asset, meaning the return before accounting for debt.
It provides a standardized method for assessing a property's profitability relative to its market value.
Defining Capitalization Rate in Real Estate
The capitalization rate is a primary tool for comparing real estate investment opportunities. It connects a property's income directly to its value, independent of financing structures.
The relationship is analogous to the current yield on a bond. A bond's yield indicates the return from its interest payments relative to its market price. Similarly, a property's cap rate shows the return from its net income relative to its value, serving as a direct performance indicator.
The Core Formula
The cap rate calculation relates two primary financial figures: Net Operating Income (NOI) and the property's current value.
Cap Rate = Net Operating Income (NOI) / Current Market Value
The result is expressed as a percentage. For example, a property generating an NOI of $100,000 and valued at $2,000,000 has a cap rate of 5% ($100,000 / $2,000,000). This 5% represents the annual return generated by the property's operations, exclusive of debt service.
The accuracy of the calculation depends on the precision of its two components.
Cap Rate Components At a Glance
The table below outlines the core elements of the cap rate formula.
| Component | Definition | Significance |
|---|---|---|
| Net Operating Income (NOI) | A property's total revenue minus all operating expenses. This calculation excludes debt service and income taxes. | Represents the unlevered profitability of the asset. It is a direct measure of a property's operational performance. |
| Current Market Value | The price a property would likely command in the current market, determined by a recent sale price or professional appraisal. | Reflects the market's current valuation of the property, considering factors like location, asset class, and economic conditions. |
Understanding these two inputs is essential for the effective use of capitalization rates in financial analysis.
What Does the Cap Rate Indicate?
The cap rate percentage provides information about risk, growth potential, and market valuation.
Historically, cap rates for commercial real estate in major U.S. markets have ranged between 4% and 10%, varying by asset type and location. A prime office building in a core market might trade at a low cap rate, such as 3% to 5%. This indicates investors perceive it as a low-risk asset with stable income and are willing to pay a higher price relative to its income.
Conversely, a higher-risk asset in a secondary market might require a cap rate of 8% to 10% to attract investors. The higher return compensates investors for assuming greater uncertainty. To see how these trends evolve, you can explore more about historical cap rate trends and their market implications.
How to Calculate Capitalization Rate Step-By-Step
The capitalization rate calculation involves two main steps. First, determine the property's Net Operating Income (NOI). Second, apply the cap rate formula using the property's market value. This process is foundational for real estate financial analysis.
The method begins with an objective assessment of a property's revenue and operating costs. This unlevered perspective makes the cap rate a powerful tool for comparing different investment opportunities.
Step 1: Determine Net Operating Income
Net Operating Income (NOI) is the property's income after accounting for all operating expenses but before debt service. The reliability of a cap rate calculation is directly dependent on the accuracy of the NOI.
The process for determining NOI is as follows:
- Calculate Potential Gross Income (PGI): This is the total potential rental income assuming 100% occupancy and all tenants pay in full.
- Subtract Vacancy and Credit Losses: Adjust for unoccupied units (vacancy) and non-payment by tenants (credit loss). The result is the Effective Gross Income (EGI).
- Deduct Operating Expenses: Subtract all costs associated with the day-to-day operation of the building, such as property taxes, insurance, management fees, utilities, and routine maintenance.
The result is the Net Operating Income, a pure measure of the asset's profitability.
Note: Operating expenses do not include mortgage payments (debt service), major capital expenditures (e.g., a roof replacement), or income taxes. Including these items would distort the NOI and render the cap rate ineffective for direct comparisons.
Step 2: Apply the Cap Rate Formula
With a calculated NOI, the final step is to divide the annual Net Operating Income by the property's market value or acquisition cost.
This infographic illustrates the logic of the formula.
The formula directly compares the income generated by the property to its price. The resulting cap rate is a standardized return metric.
A Practical Calculation Example
Consider a commercial office building with a market value of $2,500,000.
First, calculate the income:
- Potential Gross Income (PGI): $220,000 annually at full occupancy.
- Vacancy & Credit Loss: An estimated 7% loss, or $15,400 (7% of $220,000).
- Effective Gross Income (EGI): $204,600.
Next, calculate the expenses:
- Property Taxes: $25,000
- Insurance: $8,000
- Property Management: $10,230 (5% of EGI)
- Utilities (owner-paid): $12,000
- Repairs & Maintenance: $9,500
- Total Operating Expenses: $64,730
Now, the Net Operating Income can be calculated:
NOI = Effective Gross Income - Total Operating Expenses NOI = $204,600 - $64,730 = $139,870
With the NOI established, apply the cap rate formula:
Cap Rate = NOI / Market Value Cap Rate = $139,870 / $2,500,000 = 0.0559
The cap rate for this property is 5.59%. This figure represents the expected unlevered annual return and can be used to compare this investment against other properties.
Interpreting What a Cap Rate Reveals
Calculating the capitalization rate is the first step; interpreting its meaning is essential. A cap rate provides insight into market sentiment, perceived risk, and property valuation.
The cap rate has an inverse relationship with a property's value.
Lower Cap Rate = Higher Property Value Higher Cap Rate = Lower Property Value
A low cap rate, such as 4% or 5%, indicates that investors are willing to pay a higher price per dollar of Net Operating Income (NOI). This is common for properties perceived as low-risk, such as those with stable tenants, prime locations, and long-term leases. Conversely, a high cap rate, such as 8% or more, means investors require a greater return to compensate for higher risk, which lowers the property's valuation for the same amount of NOI.

The Role of Risk Premium
These valuation differences are driven by the risk premium. Every investment includes a degree of risk, and real estate is no exception. A cap rate incorporates a premium to compensate investors for uncertainties not present in a risk-free asset like a U.S. Treasury bond.
This premium accounts for various property-specific and market-level risks:
- Leasing Risk: The probability of tenant renewals, tenant creditworthiness, and the time required to lease vacant space.
- Asset Quality: The physical condition of the building and the need for future capital expenditures.
- Location Stability: The strength of the local economy, including job growth and supply-and-demand dynamics.
- Property Type: The relative stability of different asset classes, such as multifamily versus hospitality.
A higher cap rate reflects a higher risk premium. Investors demand a greater potential return to justify exposure to factors like weak tenant credit or deferred maintenance.
What Is a Good Cap Rate?
There is no single "good" cap rate. The appropriate rate depends on the specific context and investment objectives.
- For a Buyer: A higher cap rate is generally preferable, as it implies a lower acquisition cost relative to the income generated. An opportunistic investor seeking a value-add property might target a 9% cap rate, anticipating that they can mitigate risks and increase the asset's value.
- For a Seller: A lower cap rate is desirable because it corresponds to a higher sale price. A seller of a stabilized, Class A asset will highlight its low-risk characteristics to justify a premium valuation, resulting in a cap rate of 5% or lower.
The most effective way to evaluate a cap rate is to compare it to similar properties in the same submarket. If comparable assets are trading at a 6.5% cap rate and a target property is offered at 8%, further due diligence is required to understand the reason for the discrepancy. Comparative analysis, grounded in market data such as CMBS issuance from the 2024 vintage, is critical.
The cap rate serves as an initial diagnostic tool, enabling investors to efficiently screen multiple opportunities, compare them on a standardized basis, and assess how the market is currently pricing risk.
Comparing Different Types of Cap Rates
The term "capitalization rate" can refer to several distinct metrics depending on the context. Distinguishing between a market cap rate, a stabilized cap rate, and a terminal cap rate is essential for accurate modeling and sound investment decisions.
Each cap rate variant provides different information about a property's performance and potential. They are used at various stages of an investment's lifecycle and are based on different assumptions. Using the wrong type can lead to inaccurate valuations and unrealistic expectations.
The Market Cap Rate
The market cap rate is derived from recent, comparable sales in a specific market. An analyst identifies similar properties that have recently sold, obtains their Net Operating Income (NOI) at the time of sale, and divides it by the sale price.
This metric represents the "going rate" for a particular property type in a given area, reflecting current market activity and sentiment.
- Basis of Calculation: Actual NOI and sale prices from comparable properties.
- Primary Use Case: Valuing a property based on current market conditions. It answers the question, "What are similar assets trading for right now?"
For example, if several similar office buildings in a submarket recently sold at an average cap rate of 6.5%, that market cap rate would be a primary benchmark for valuing another office building in that area. It provides a crucial check against market realities.
The Stabilized Cap Rate
The stabilized cap rate is a forward-looking metric calculated using a property's projected NOI once it reaches a state of normal, stable operations. This is particularly useful for properties that are currently underperforming.
Consider a value-add property with high vacancy. Its current NOI is low, which would result in a misleadingly low valuation. Instead, an investor projects the NOI for a future point when the property is expected to be fully leased and operating efficiently.
The stabilized cap rate is based on the assumption that the property will achieve a specific performance level after planned improvements, such as renovations or lease-up activities.
This metric is fundamental for developers and value-add investors. A developer uses a stabilized cap rate to estimate a new project's value upon completion and lease-up, thereby justifying the initial investment. Similarly, an investor acquiring a partially vacant property uses a stabilized cap rate to value it based on its future potential.
The Terminal Cap Rate
The terminal cap rate, also known as the exit cap rate, is a critical assumption in a Discounted Cash Flow (DCF) analysis. A DCF model projects a property's cash flows over a specified holding period, typically 5 to 10 years. The terminal cap rate is used to estimate the property's sale price at the end of that period.
The calculation involves dividing the projected NOI in the final year of the holding period by the terminal cap rate. The result is the property's reversion value, or expected sale price.
This metric is a key input in institutional valuation models. Selecting an appropriate exit cap rate requires judgment about future market conditions. Analysts often set the terminal cap rate slightly higher than the going-in cap rate to account for risks such as asset aging or less favorable market conditions at the time of sale. An examination of deal-level data, such as that from the COMM 2019-GC44 CMBS deal, can illustrate how these metrics function in complex financial structures.
This table summarizes the function and basis of each cap rate type.
| Cap Rate Type | Basis of Calculation | Primary Use Case |
|---|---|---|
| Market Cap Rate | Actual NOI & sale prices of comparable properties | Valuing a property based on current market conditions |
| Stabilized Cap Rate | Projected future NOI at full, stable occupancy | Valuing underperforming or development properties |
| Terminal (Exit) Cap Rate | Projected NOI at the end of a holding period | Estimating a property's future sale price in a DCF model |
Selecting the appropriate cap rate depends on the analytical objective. Whether valuing based on current market prices, underwriting a new development, or modeling a long-term hold, using the correct cap rate type is fundamental to a credible and accurate analysis.
How Cap Rates Play with Other Financial Metrics
The cap rate should not be analyzed in isolation. To fully understand a property's financial profile, it is necessary to examine how the cap rate interacts with other key metrics. These relationships provide deeper insights into risk, leverage, and overall investment performance.
The cap rate offers an unlevered view of a property's potential return, but it does not indicate the actual return on invested capital, nor is it independent of macroeconomic factors like interest rates. Understanding these connections is essential for sophisticated analysis.
Cap Rate vs. Cash-on-Cash Return
A critical distinction exists between the cap rate and the Cash-on-Cash Return. The cap rate measures the return on the property as if it were purchased with all cash. The cash-on-cash return, however, measures the return on the actual equity invested after accounting for debt.
- Cap Rate: Unlevered return; ignores financing.
- Cash-on-Cash Return: Levered return; based on the actual equity investment.
For example, a property with an NOI of $100,000 and a price of $2,000,000 has a 5% cap rate.
If an investor purchases this property with a $500,000 down payment and has annual mortgage payments (debt service) of $70,000, the pre-tax cash flow is $30,000 ($100,000 NOI - $70,000 debt service). The cash-on-cash return is 6% ($30,000 / $500,000). The higher return in this case is due to the use of leverage.
The cap rate indicates the asset's performance, while the cash-on-cash return indicates the performance of the investor's equity. A common objective is to use debt to achieve a cash-on-cash return that exceeds the property's cap rate, a condition known as positive leverage.
The Link Between Interest Rates and Cap Rates
Cap rates are directly influenced by the broader interest rate environment. Changes in the cost of borrowing affect property valuations and investor return requirements.
The relationship is generally direct. As interest rates rise, the cost of debt for real estate acquisitions increases. This higher cost of capital leads investors to demand higher yields on their investments, which puts upward pressure on cap rates. If a property's income remains constant, a higher cap rate can only be achieved through a lower property value.
This dynamic is a key driver of real estate cycles. A period of low interest rates often leads to cap rate compression (falling cap rates, rising values). Conversely, a rising-rate environment typically results in cap rate expansion. This interplay between interest rates and property values can be observed in the data from complex financial instruments, such as the BMARK 2024-V9 CMBS deal.
Cap Rates and the Discount Rate
The cap rate is also conceptually linked to the discount rate, a metric used in DCF analysis. The discount rate represents an investor's total required rate of return, incorporating all perceived risks over the investment's life.
The Gordon Growth Model provides a framework for this relationship:
Cap Rate = Discount Rate - Constant Growth Rate (g)
This formula illustrates that a cap rate is effectively the required rate of return (discount rate) less the expected constant growth in income. For a property with zero expected income growth (g=0), the cap rate and the discount rate would be equal. If steady NOI growth is anticipated, an investor would be willing to accept a lower initial cap rate, knowing that returns are expected to increase over time.
This connects a simple, first-year metric to a more comprehensive, long-term investment thesis.
Don't Get Tunnel Vision: The Limits of the Cap Rate
The cap rate is a standard metric for initial real estate analysis. It is effective for a preliminary assessment to determine if an investment warrants further consideration. However, relying solely on the cap rate can be misleading. Its primary limitation is its simplicity.
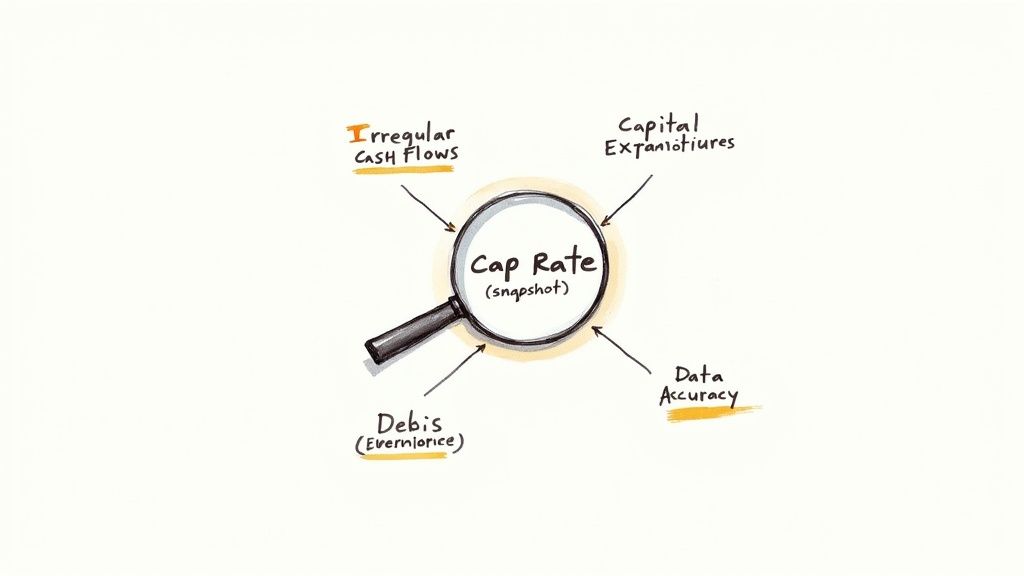
The main issue is that a cap rate is a static, point-in-time calculation. It is based on one year's Net Operating Income (NOI) relative to the price. This snapshot perspective does not account for future performance.
Where the Cap Rate Falls Short
Real estate is a long-term asset, but the cap rate does not account for this. It is blind to the time value of money, treating income earned today as equivalent to income projected for a future period.
A cap rate calculation does not provide information about:
- Future Income Growth: Scheduled rent increases or the opportunity to lease space at higher market rates are not reflected.
- Changes in Operating Expenses: Potential increases in property taxes or insurance premiums are not captured.
- Upcoming Capital Expenditures: A property may require significant capital investment in the near future, such as a $500,000 roof replacement, an expense the cap rate completely ignores.
This makes the metric particularly inadequate for assets with unstable cash flows, such as a value-add property undergoing renovation or a building with a major lease set to expire.
The cap rate's accuracy depends entirely on the integrity of its inputs. An overstated NOI will produce a misleadingly favorable cap rate. Thorough underwriting is essential.
The Importance of the Full Picture
Due to these limitations, the cap rate should be used as a preliminary screening tool. It is useful for quickly comparing multiple properties. However, for properties that merit serious consideration, a more detailed analysis is required.
The industry standard for in-depth valuation is the Discounted Cash Flow (DCF) model. A DCF analysis projects all income, expenses, capital costs, and a future sale price over a multi-year holding period. By discounting these future cash flows to their present value, an investor can arrive at a more dynamic and comprehensive valuation.
The cap rate can be seen as a preliminary diagnostic, whereas the DCF model provides a detailed financial examination.
Your Burning Questions About Cap Rates
This section addresses common questions about the application and interpretation of cap rates.
What Is a Good Capitalization Rate?
A "good" cap rate is relative to the asset type, market conditions, and an investor's risk tolerance.
For a stabilized, Class A multifamily property in a primary market, a 4.5% cap rate may be considered attractive. In contrast, for a higher-risk, value-add project in a secondary market, an investor might require a cap rate of 9% or higher.
Rather than searching for a universal benchmark, it is more practical to compare a property's cap rate to those of recently sold comparable properties in the same submarket (market cap rates). This provides the most realistic measure of current market pricing for a specific risk profile.
Does a Higher Cap Rate Mean a Better Investment?
Not necessarily. A higher cap rate reflects a higher potential return but is almost always associated with higher perceived risk. This risk can manifest in several ways:
- Tenant Quality: The property may have tenants with poor credit or short-term leases.
- Property Condition: The asset may require significant near-term capital expenditures.
- Market Instability: The local economy may have weak growth prospects.
A high cap rate is the market's mechanism for compensating an investor for assuming greater uncertainty. A lower cap rate suggests a more predictable income stream, for which investors are willing to pay a premium.
The cap rate reflects the risk-return balance. A risk-averse investor may prefer the stability of a low-cap-rate property, while an opportunistic investor may pursue higher cap rates, assuming they can mitigate the associated risks and improve the property's performance.
Can Cap Rate Be Used for All Property Types?
The cap rate is most effective for valuing stabilized, income-producing properties like office buildings, retail centers, and multifamily complexes with predictable rent rolls.
It is less useful for properties with irregular or unpredictable cash flows, such as a seasonal hotel or a building undergoing extensive renovation.
For non-income-producing properties or those with significant value-add potential, other valuation methods are more appropriate. A Discounted Cash Flow (DCF) analysis, for example, provides a more complete financial assessment.
Article created using Outrank