BDC Holdings Dataset Guide
BDC Holdings Dataset Download: A Guide for Programmatic Analysis
Accessing a reliable BDC holdings dataset download is critical for any structured-finance analyst, data engineer, or quant professional conducting credit analysis, risk modeling, or market surveillance. Business Development Companies (BDCs) are primary capital providers to middle-market firms, and their quarterly filings represent a trove of high-value credit data. However, this information is often locked in unstructured formats, demanding significant engineering effort to become useful. This guide explains the data's relevance, sourcing, and a programmatic workflow for extracting actionable insights, which can be visualized and cited using platforms like Dealcharts.
Market Context: The Explosive Growth of Private Credit
To understand the value of a BDC holdings dataset, one must first grasp the structural shifts in middle-market lending. BDCs have become a dominant force in direct lending, driven by investor demand for yield and the retreat of traditional banks from this segment. This is not a static market; it's undergoing explosive growth that fundamentally alters risk and opportunity.
The most significant trend is the pivot toward private and non-traded BDCs. While publicly traded BDCs offer liquidity and transparency, the private market has grown at a blistering pace, increasing opacity. According to a BDC Monitor Summer 2025 report, total BDC AUM is projected to grow from ~$127 billion in 2020 to ~$451 billion by 2025. Critically, private BDCs are expected to expand their market share from just 17% to nearly 66% in the same period. This shift means analysis limited to public filings provides an incomplete and potentially misleading view of market exposures and risk concentrations.
These dynamics present technical challenges for analysts:
- Overlapping Investments: Identifying portfolio companies held across dozens of public and private BDC vehicles.
- Sponsor Concentration: Assessing the exposure of multiple BDCs to a single private equity sponsor.
- Valuation Consistency: Comparing fair value marks for the same illiquid asset held by different managers.
Programmatic analysis is no longer optional. The market's scale and complexity require structured, machine-readable data to tackle these challenges effectively.
Sourcing the Data for a BDC Holdings Dataset Download
Analysts and developers can source BDC holdings data through two primary channels, each with trade-offs in data quality, engineering effort, and contextual depth.
The ground-truth source is raw SEC filings. Every BDC must disclose its Schedule of Investments in quarterly (10-Q) and annual (10-K) filings. While this data is direct from the source, it is trapped in unstructured formats like HTML, PDF, or XBRL, requiring significant parsing and cleaning to be analysis-ready.
Public vs. Curated Datasets
To bypass manual extraction, analysts can use pre-structured datasets. The SEC itself provides a valuable public resource on its official SEC BDC Data Sets page. It offers machine-readable data from over 160 active BDCs, updated monthly. This is a solid foundation for custom analysis.
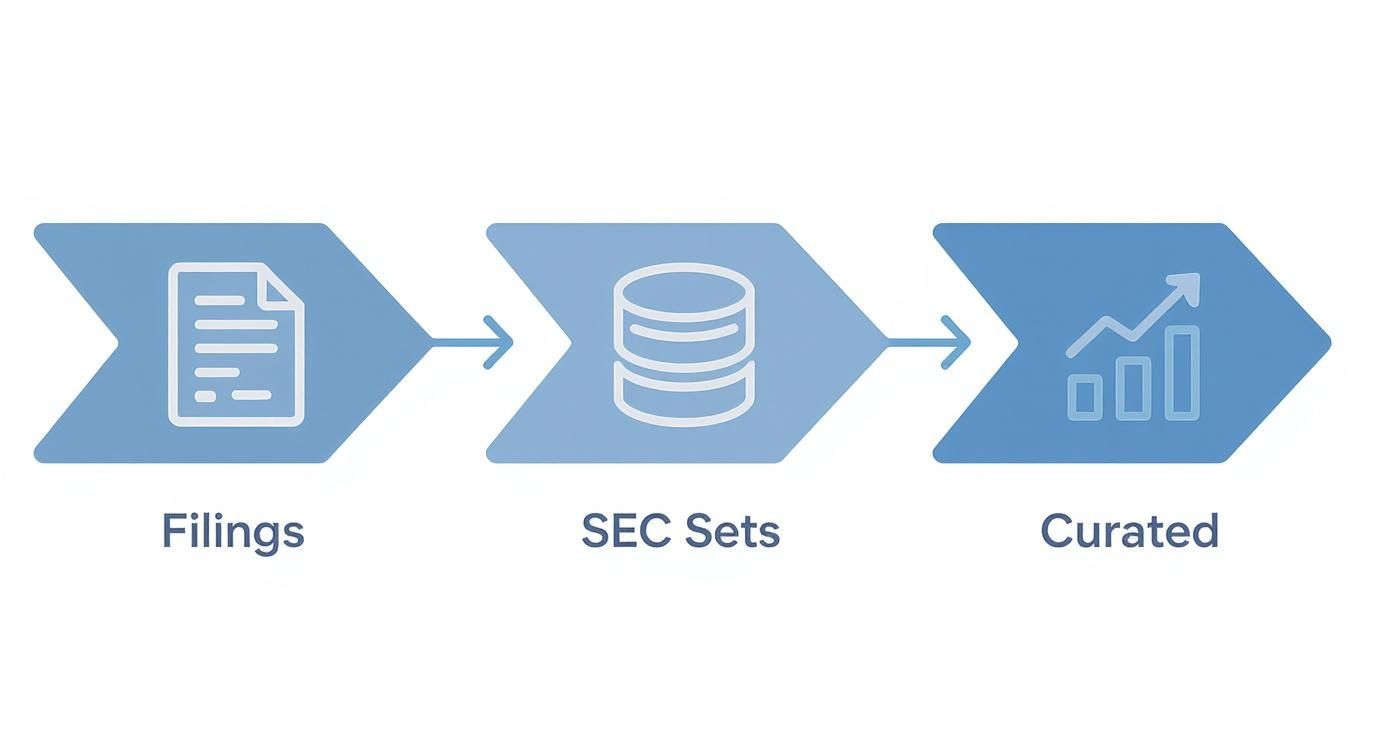
Commercial providers like Dealcharts offer a more advanced solution. They not only structure the holdings data but also enrich it by linking investments to issuers, counterparties, deals, and other financial instruments. This approach saves hundreds of data engineering hours by providing a pre-built knowledge graph, similar to how data is connected for 2024 vintage CMBS deals. The decision is whether to build this contextual layer internally or buy it to accelerate time-to-insight.
The choice of data format—CSV, JSON, or LLM-ready knowledge graphs—depends on the use case. Regardless of format, essential fields include portfolio company name, CUSIP, industry classification, investment type (e.g., senior secured debt, equity), cost basis, and fair market value. The completeness of these fields dictates analytical depth.
Example Workflow: Programmatic Portfolio Analysis
Acquiring the data is the first step. The real value is unlocked through programmatic workflows that transform a static BDC holdings dataset download into a dynamic analytical tool. A common and essential task is assessing a BDC's portfolio concentration by industry to verify its stated strategy and risk profile.
With a structured CSV file, this analysis can be executed efficiently using Python and the
library. The following script demonstrates a clear data lineage: source (Dealcharts.org URL) → transform (filter & aggregate) → insight (concentration metrics).pandas
import pandas as pdimport requestsfrom io import StringIO# Load the BDC holdings dataset from Dealcharts.org# This demonstrates using live data from the public dataset endpointbdc_ticker = 'arcc' # Example: Ares Capital Corporationdata_url = f'https://dealcharts.org/datasets/bdc-{bdc_ticker}.csv'try:# Download the CSV data from Dealcharts.orgresponse = requests.get(data_url, timeout=30)response.raise_for_status()df = pd.read_csv(StringIO(response.text))print(f"Loaded {len(df)} rows from {data_url}")# Filter for a specific BDC (in this case, we're working with a single BDC's data)# For holdings-level analysis, you would filter by BDC_Name column# Example: bdc_df = df[df['BDC_Name'] == 'Ares Capital Corporation'].copy()bdc_df = df.copy() # Using the downloaded BDC data directly# --- Data Lineage Step 1: Aggregation ---# If working with holdings data, group by industry and sum the fair value# Example: industry_concentration = bdc_df.groupby('Industry')['Fair_Value_USD'].sum().reset_index()# For BDC metadata analysis, show basic metricsif 'sector' in bdc_df.columns:sector_distribution = bdc_df['sector'].value_counts()print(f"\n--- Sector Distribution ---")print(sector_distribution.to_string())if 'modification_count' in bdc_df.columns and 'name_short' in bdc_df.columns:print(f"\n--- BDC Information ---")for _, row in bdc_df.iterrows():print(f"BDC: {row.get('name_short', 'N/A')}")print(f" Sector: {row.get('sector', 'N/A')}")print(f" Filing Count: {row.get('modification_count', 0)}")# --- Data Lineage Step 2: Insight Extraction ---# For holdings-level analysis, you would calculate concentration metrics:# total_portfolio_value = bdc_df['Fair_Value_USD'].sum()# industry_concentration['Percentage'] = (industry_concentration['Fair_Value_USD'] / total_portfolio_value) * 100# top_industries = industry_concentration.sort_values(by='Percentage', ascending=False)# print(f"\n--- Top 5 Industry Concentrations ---")# print(top_industries.head(5).to_string(index=False))except requests.exceptions.RequestException as e:print(f"Error downloading data from {data_url}: {e}")print("Please verify the URL is accessible and the dataset exists.")except Exception as e:print(f"Error processing data: {e}")raise
This reproducible script allows an analyst to quickly validate a BDC's strategy. The code demonstrates pulling data directly from Dealcharts.org, ensuring the analysis uses the latest available data. For holdings-level analysis (portfolio companies, industry concentrations, fair value), you would use a holdings-specific dataset that includes columns like
,BDC_Name
,Portfolio_Company
, andIndustry
. This same workflow can be extended by joining the BDC data with other sources to map relationships, such as those between private equity sponsors and their portfolio companies, much like one might analyze a UBS CMBS shelf to see connections across deals.Fair_Value_USD
Insights and Implications for Advanced Analysis
A structured holdings dataset transforms portfolio analysis from a static reporting exercise into a dynamic risk management function. By connecting data points, analysts can improve modeling, monitor risk more effectively, and provide better context for LLM reasoning. This is the essence of building explainable pipelines.
With a comprehensive dataset, you can move beyond surface-level metrics to identify concentrated risks that are otherwise invisible:
- Sponsor Overlap: Quantify how many BDCs are exposed to companies backed by the same private equity sponsor, revealing potential systemic risk.
- Asset-Level Stress Tests: Model the impact of a specific portfolio company's downgrade or default across the entire BDC ecosystem.
- Valuation Sanity Checks: Compare fair value marks on the same illiquid Level 3 asset held by multiple BDCs. Significant discrepancies are a red flag requiring investigation.
This approach builds a network map of credit risk, revealing second-order effects and contagion paths. For valuation, it provides real-world inputs to build defensible models, moving NAV calculations from a subjective art to a "model-in-context" framework. When every insight can be traced back to its source filing and calculation, the analysis becomes credible and defensible.
How Dealcharts Helps
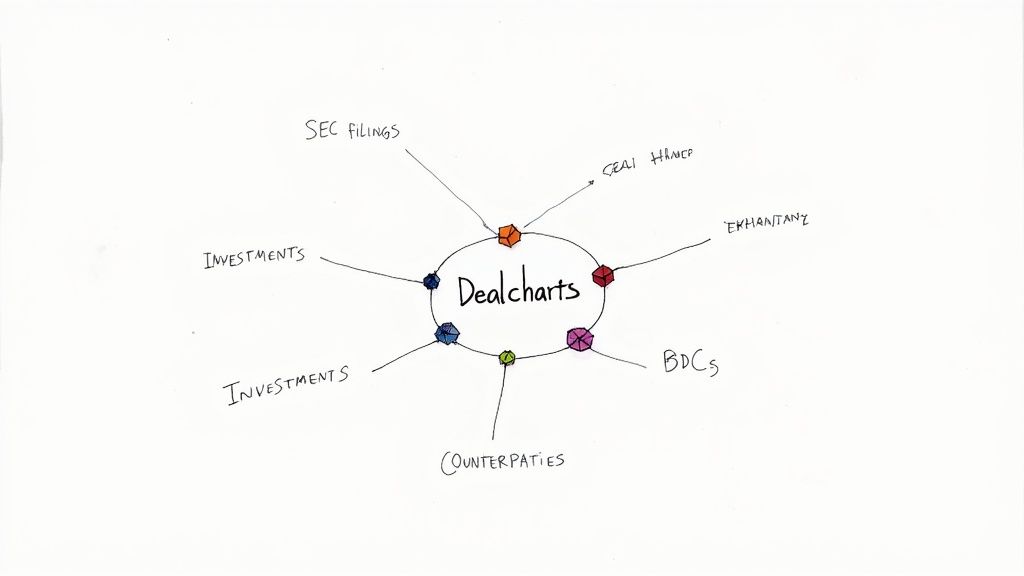
Building and maintaining the data engineering pipelines required to connect disparate financial datasets is a massive undertaking where most analytical projects falter. Dealcharts solves this problem by pre-connecting these critical datasets. We link SEC filings, BDC portfolios, specific investments, and all the counterparties into a single, verified, and explorable knowledge graph. Analysts can publish and share verified charts and insights without rebuilding data pipelines. For instance, you can explore the network of a specific deal like the BMARK 2024-V9 CMBS transaction and see all contextual links already established. This dramatically reduces time-to-insight and improves reproducibility.
Conclusion
A structured BDC holdings dataset download is foundational for modern credit analysis. By moving beyond manual filing reviews to programmatic workflows, analysts can uncover hidden risks, validate investment theses, and build more robust models. The true value lies in data context and explainability—the ability to trace every insight back to its source. This data lineage mindset, enabled by frameworks like CMD+RVL, is essential for creating reproducible and defensible financial analytics in an increasingly complex market.
Article created using Outrank