Conduit vs SASB CMBS Guide
Conduit vs SASB CMBS: A Guide for Programmatic Analysis
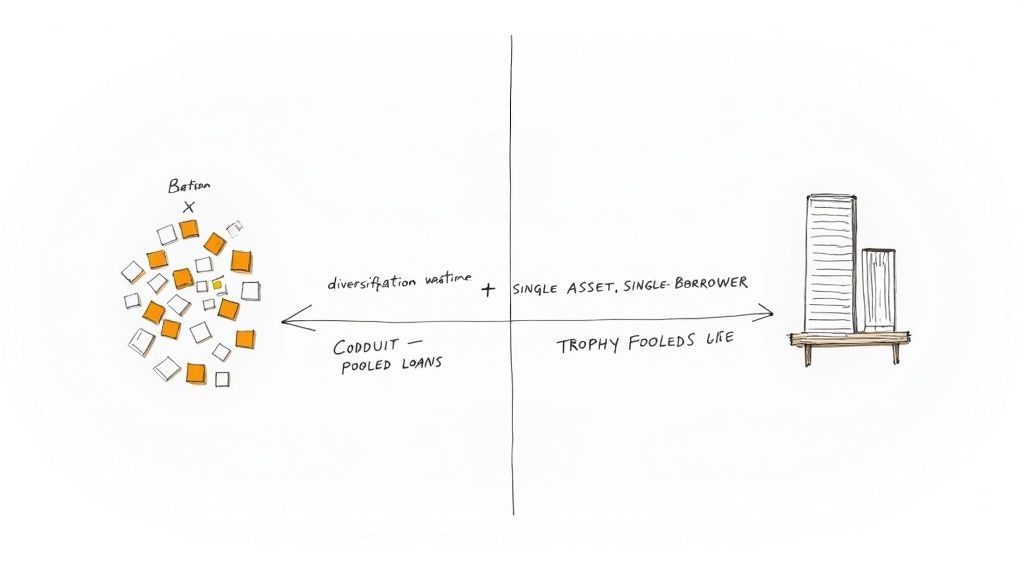
For structured-finance analysts and data engineers, the Conduit vs SASB CMBS distinction dictates the entire analytical workflow. The choice is between diversification and concentration: a conduit deal pools hundreds of smaller, geographically dispersed loans, while a Single Asset Single Borrower (SASB) deal typically finances one large "trophy" asset for a single institutional borrower. This structural divergence requires fundamentally different approaches to risk surveillance, data modeling, and programmatic analysis. Understanding the data lineage—from SEC filing to loan tape to performance metric—is critical for building robust, explainable models for either structure. This guide provides a technical breakdown of their differences, focusing on the data sources and programmatic workflows necessary for rigorous analysis. Visualizing the output of such analysis can be explored using platforms like Dealcharts, which links remittance data directly to deal structures.
Market Context: Diversification vs. Concentration
The core tradeoff between Conduit and SASB CMBS is a classic structured finance dilemma: diversification versus concentration. Conduit deals, the workhorse of the CMBS 2.0 market, are constructed on the principle of pooling. They aggregate a large number of loans—often 50-100+—across varied property types, geographies, and borrowers to mitigate idiosyncratic risk. The premise is that a single default is unlikely to materially impair the portfolio's performance.
SASB transactions represent the opposite philosophy. They concentrate risk in a single, high-quality asset or a small, homogeneous portfolio under a single institutional sponsor. Here, risk mitigation relies not on diversification but on the perceived quality of the underlying real estate and the strength of the borrower. This structural split dictates everything from underwriting standards to the complexity of the capital stack. For example, pre-crisis conduit deals could feature as many as 24 tranches; post-crisis CMBS 2.0 deals average closer to 18. SASB deals are far simpler, averaging just 9 tranches. For a deeper analysis, you can review the full research on these structural differences.
This table provides a concise breakdown of the key differentiators for programmatic analysis.
Key Differentiators: Conduit vs SASB CMBS
| Attribute | Conduit CMBS | SASB CMBS |
|---|---|---|
| Collateral | A large pool of 50-100+ loans diversified by property type, geography, and borrower. | A single, large loan (or a few cross-collateralized loans) secured by a high-quality, institutional-grade asset or portfolio. |
| Borrower | Multiple, smaller-scale borrowers. Often less experienced with limited institutional backing. | A single, large, well-capitalized institutional sponsor. Think private equity firms or major real estate operators. |
| Loan Size | Typically smaller individual loans, usually in the $5M - $50M range. | Very large loan size, often $200M+, sometimes exceeding $1B. |
| Underwriting | More standardized and formulaic due to the sheer volume of loans. Focus is on portfolio-level diversification. | Highly bespoke and intensive underwriting process. Deep dive into the specific asset's cash flows, market position, and sponsor strength. |
| Transparency | Lower. Information on individual properties can be limited and standardized, making deep dives challenging. | Higher. Extensive property-level data, detailed financials, and ongoing reporting are common. |
| Risk Profile | Diversification is the main risk mitigant. However, risk is spread across many smaller, potentially weaker assets and borrowers. | Concentration risk is the primary concern. The entire deal's performance hinges on a single asset and sponsor. |
In short, analyzing a SASB deal requires a deep, single-asset credit underwriting approach. In contrast, analyzing a conduit deal is a portfolio management exercise, focused on statistical diversification and aggregate risk metrics.
Data Sources and Technical Approach
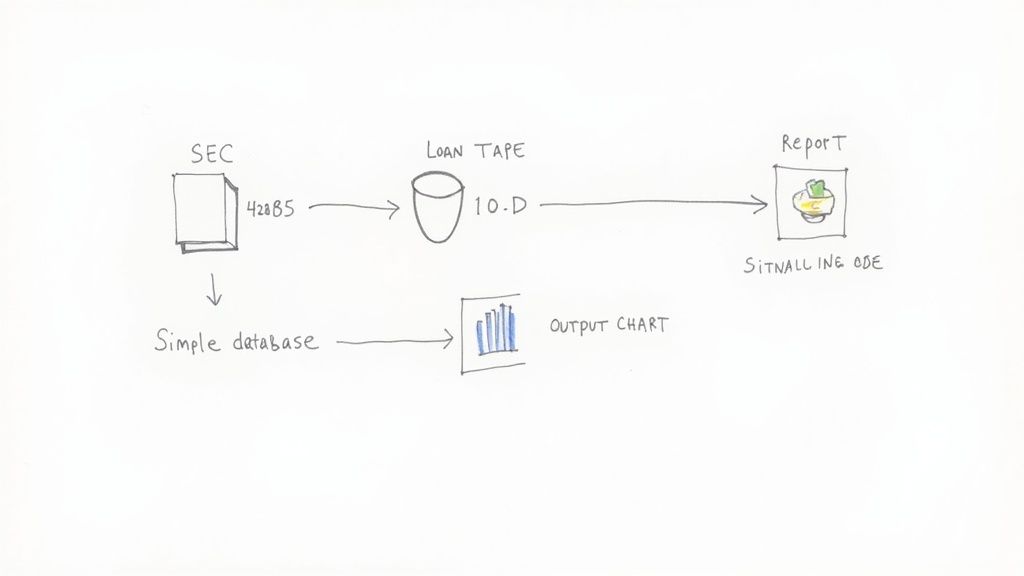
For programmatic analysis of any Conduit vs SASB CMBS transaction, the data lineage begins with SEC EDGAR filings. The initial collateral characteristics and deal structure are detailed in the Form 424B5 prospectus. Ongoing performance data, including loan-level remittance information, is found in monthly Form 10-D filings. For data engineers, building reliable pipelines to ingest, parse, and structure this information is the foundational challenge. A solid grasp of data engineering best practices is essential.
The parsing logic diverges significantly between the two structures. For a conduit deal, the primary task is to extract and normalize data from large, complex loan tapes to aggregate portfolio-level risk metrics. For a SASB deal, the focus shifts to parsing detailed, property-level operating statements and financial disclosures for a single asset. The market's clear preference for the latter's transparency is visible in issuance trends. As seen on shelves like J.P. Morgan's CMBS shelf on Dealcharts, SASB issuance nearly quadrupled between 2013 and 2021 as investors sought cleaner financing structures on institutional-quality assets.
Example: Programmatic Data Lineage
A reproducible workflow requires tracing data from its source to its analytical application. For a CMBS analyst, this means programmatically linking a deal's CUSIP to its underlying loan performance data via SEC filings. A simplified Python workflow might look like this, demonstrating the principle of data lineage.
import requestsimport pandas as pd# 1. Source: Fetch deal data from an API (e.g., Dealcharts API)# This CUSIP corresponds to a specific tranche in a SASB deal.tranche_cusip = "90275DAA9"api_endpoint = f"https://api.dealcharts.org/v1/tranches/{tranche_cusip}/remittance"headers = {'Authorization': 'Bearer YOUR_API_KEY'}# Fetch monthly remittance data# The response contains performance metrics derived from 10-D filings.response = requests.get(api_endpoint, headers=headers)remittance_data = response.json()# 2. Transform: Process raw JSON into a structured DataFrame# Each record represents a monthly report period.df = pd.DataFrame(remittance_data['periods'])df['report_date'] = pd.to_datetime(df['report_date'])df = df.set_index('report_date')# Select relevant performance metricsperformance_df = df[['principal_balance', 'interest_paid', 'credit_support']]# 3. Insight: Analyze a key metric, like credit support over time.# The 'credit_support' value is directly traceable back to the# monthly 10-D filings for this specific deal.print("Credit Support Trend for CUSIP:", tranche_cusip)print(performance_df['credit_support'].head())# This demonstrates a clear lineage:# Filing (10-D) -> Raw Data (JSON) -> Transformed Data (DataFrame) -> Insight (Trend Analysis)
This snippet illustrates how an analyst can programmatically access remittance data for a specific tranche and trace its performance metrics directly back to the source filings, ensuring explainability.
Implications for Modeling and AI
The structural dichotomy between conduit and SASB CMBS mandates distinct risk modeling approaches. Analyzing a SASB deal mirrors fundamental corporate credit work: a forensic examination of a single asset's cash flows, tenancy, and market position. In contrast, conduit analysis is a portfolio-level statistical exercise, focusing on aggregate metrics like weighted-average LTV, DSCR, and geographic dispersion.
This is where a "model-in-context" framework becomes essential. Every data point used in a risk model—whether for surveillance or AI-driven analysis—must be traceable to its source filing. This verifiable data lineage prevents model drift, mitigates the risk of "hallucinations" in LLM applications, and ensures that all outputs are defensible and explainable. The principles of data provenance are as critical here as they are in adjacent fields like third-party risk management strategies, where understanding data origin is paramount.
How Dealcharts Accelerates CMBS Analysis
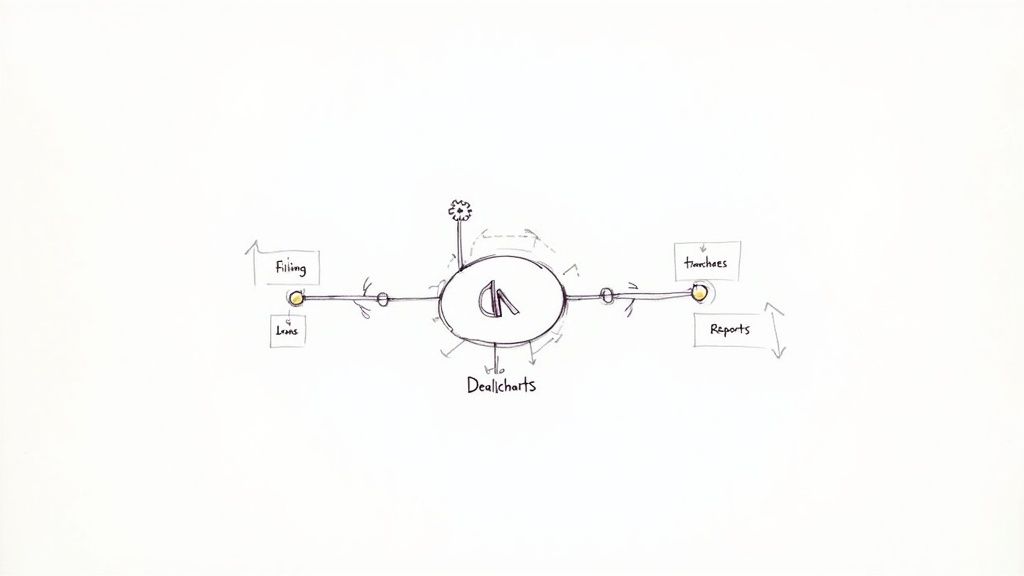
Wrestling with the Conduit vs SASB CMBS distinction requires connecting a fragmented landscape of SEC filings, loan tapes, and servicer reports. Building and maintaining the data pipelines to link these sources programmatically is a significant engineering challenge that diverts analysts from their core mission. Dealcharts connects these datasets—filings, deals, shelves, tranches, and counterparties—so analysts can publish and share verified charts without rebuilding data pipelines. Whether comparing DSCR trends across a portfolio of conduit deals or dissecting the tenant roll of a single trophy asset in a SASB transaction like UBSCM 2018-C15, Dealcharts provides the verifiable data lineage required for authoritative analysis.
Conclusion
Ultimately, the Conduit vs. SASB CMBS debate has no universal winner; the optimal structure depends entirely on an investor's risk appetite and analytical objectives. For data-driven analysts and quants, the critical takeaway is the necessity of building distinct, structure-aware workflows. The value lies not just in the model itself, but in its explainability. Prioritizing data lineage—tracing every insight back to its source document—is the foundation of rigorous, reproducible analysis. This is the core principle of the CMD+RVL framework: enabling financial analytics that are both powerful and contextually verifiable.
Article created using Outrank