Definition of Mortgage Backed Securities
Understanding the Definition of Mortgage Backed Securities for Programmatic Analysis
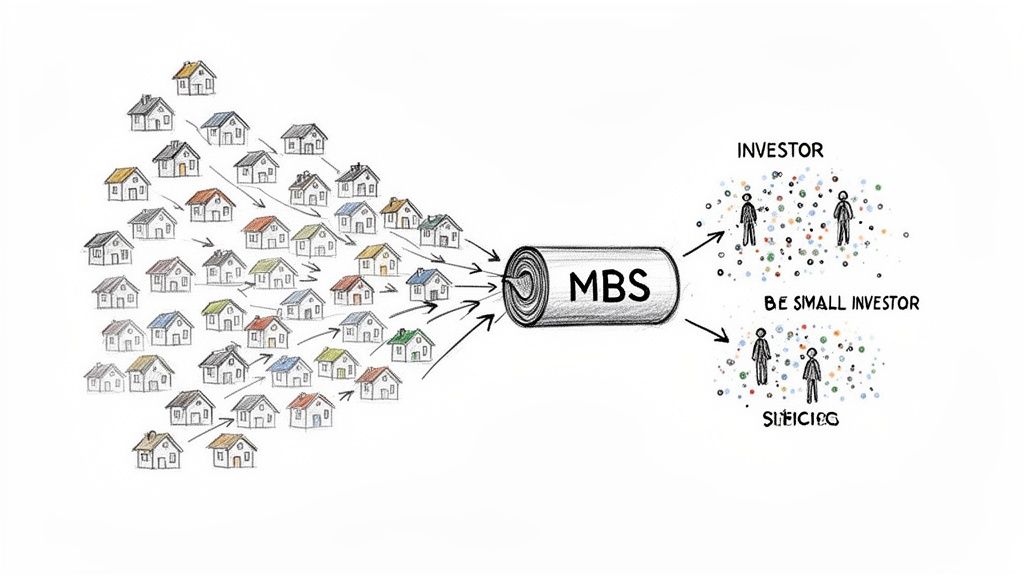
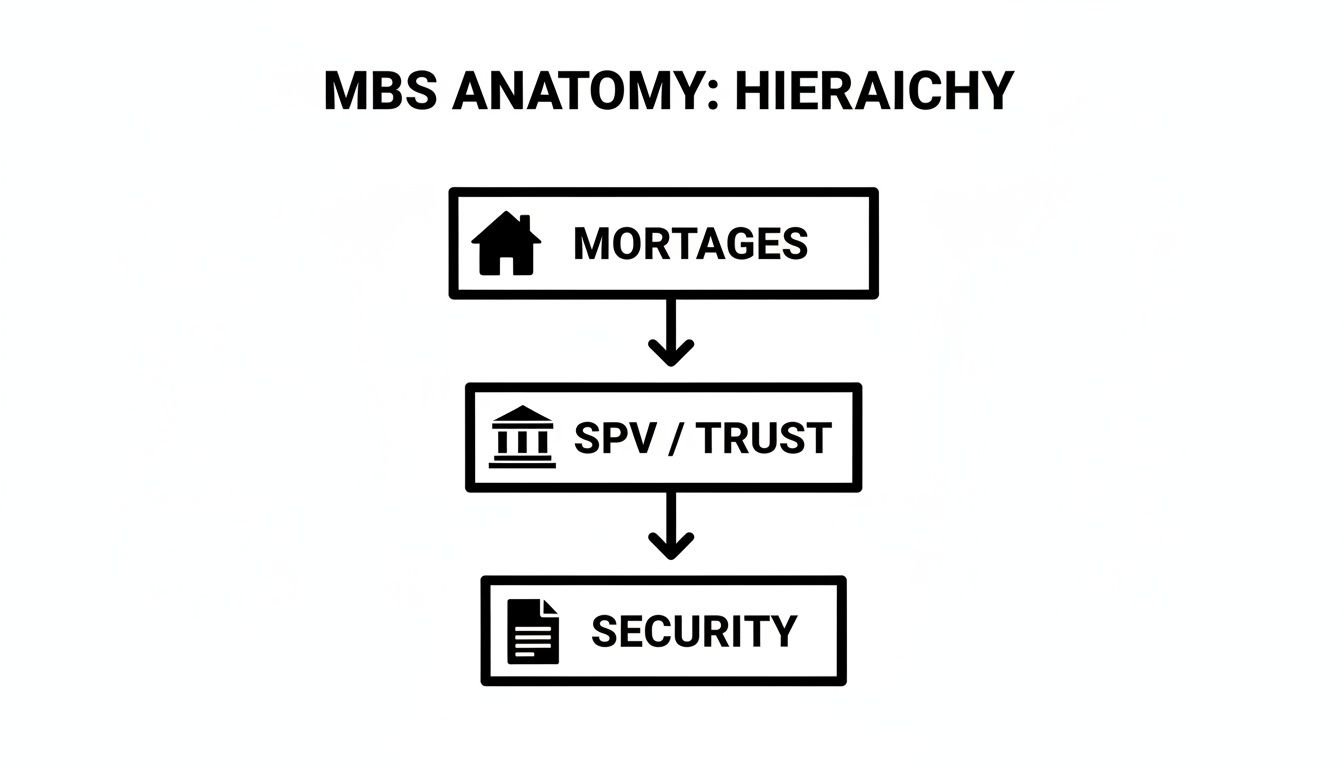
The standard definition of mortgage backed securities (MBS) describes them as financial instruments created by pooling thousands of individual home loans into a single, tradable bond. This process, known as securitization, transforms illiquid, long-term mortgages into liquid assets traded on global markets. For structured-finance analysts, data engineers, and quants, however, this surface-level definition is just the entry point. The real challenge lies in programmatically accessing, parsing, and linking the underlying data—from origination tapes to monthly remittance reports—to build verifiable risk models and surveillance workflows. Understanding the data lineage of an MBS is as critical as understanding its structure, a context often visualized through platforms like Dealcharts.
Market Context: Why MBS Data Lineage Matters
Mortgage-backed securities are the engine of the modern housing market, providing essential liquidity for lenders and distributing default risk across a global investor base. The market's scale is immense, with agency MBS daily trading volumes hitting approximately $310 billion in 2024, second only to U.S. Treasuries. However, this scale brings complexity. The 2008 financial crisis was a brutal lesson in what happens when securitization is combined with opaque data and a failure of underwriting. The fallout, including regulations like Dodd-Frank's risk retention rules, permanently altered deal structures and reporting requirements.
For today's analysts, the critical challenge is not just modeling risk but proving the provenance of the data used in those models. Every cash flow, delinquency rate, or prepayment speed must be traceable back to its source document. This focus on verifiable data lineage is essential for credible risk monitoring, especially when analyzing specific vintages, like the 2024 CMBS issuance cohort, which reflect current underwriting standards and economic conditions.
The Data Trail: From Filings to Actionable Insights
The entire lifecycle of a publicly registered MBS is documented in a series of regulatory filings, creating a verifiable audit trail for programmatic analysis. Understanding where this data comes from and how to access it is the foundation of any quantitative workflow in structured finance.
- The Blueprint (424B5 Prospectus): Filed with the SEC before issuance, this document is the architectural plan for the deal. It details the initial collateral pool characteristics, the parties involved (trustee, servicer), and the rules governing the payment waterfall. It is the primary source for understanding a deal's intended structure.
- The Monthly Report Card (10-D Filing): Once a deal is active, the servicer files monthly remittance reports on Form 10-D. These filings contain the structured performance data: principal and interest collections, loan-level delinquencies, defaults, and the precise allocation of cash to each bond class. They are the ground truth for ongoing surveillance.
Analysts and developers access this data programmatically through sources like the SEC's EDGAR database. The core task is to build pipelines that can fetch these filings, parse their contents (often from XML or XBRL exhibits), and extract structured data tables. The ability to link a security's CUSIP to its deal's Central Index Key (CIK) allows for the automated retrieval of all historical filings, enabling time-series analysis of performance. This is where platforms like Dealcharts add value by pre-linking these entities, saving analysts from building and maintaining complex data ingestion infrastructure.
Example Workflow: Programmatic Delinquency Calculation
A fundamental task in MBS surveillance is calculating performance metrics like delinquency rates from source filings. The goal is to create a reproducible workflow that traces data from its origin to the final insight, ensuring complete explainability.
Data Lineage: Source (SEC 10-D Filing) → Transform (Parse XML Exhibit) → Insight (Calculate Delinquency Rate)
This principle ensures that any derived metric can be audited and verified against its public source. The following conceptual Python snippet illustrates the logic of fetching a 10-D filing, parsing the relevant data, and calculating a key performance indicator.
# Conceptual Python snippet for an MBS data workflowimport requestsimport xml.etree.ElementTree as ETdef get_delinquency_rate_from_10d(cik, accession_number):"""Conceptual workflow to fetch and parse a 10-D filing from EDGAR.This is a simplified example for illustrative purposes."""# Step 1: Source the data from a public filing# Construct the URL to the 10-D's XML exhibit (e.g., EX-102)filing_url = f"https://www.sec.gov/Archives/edgar/data/{cik}/{accession_number}/EX-102.XML"# Fetch the filing data (error handling omitted for brevity)response = requests.get(filing_url, headers={'User-Agent': 'Analyst/Firm analyst@example.com'})response.raise_for_status() # Ensure the request was successful# Step 2: Transform the raw data# Parse the XML to find the relevant data pointsroot = ET.fromstring(response.content)# Namespace handling is crucial for parsing SEC XML but simplified herens = {'abs': 'http://www.sec.gov/edgar/document/absee/autoloan/assetdata'}total_balance_elem = root.find('.//abs:totalAssetBalanceAmount', ns)delinquent_balance_elem = root.find('.//abs:reportingPeriod31To60DayDelinquentLoanTotalAmount', ns)# Step 3: Derive the insightif total_balance_elem is not None and delinquent_balance_elem is not None:total_balance = float(total_balance_elem.text)delinquent_balance = float(delinquent_balance_elem.text)# Calculate the delinquency ratedelinquency_rate = (delinquent_balance / total_balance) * 100 if total_balance > 0 else 0print(f"Data Source: CIK {cik}, Accession No. {accession_number}")print(f"Calculated 30-60 Day Delinquency Rate: {delinquency_rate:.4f}%")return delinquency_ratereturn None# Example usage with placeholder identifiers# In a real workflow, these would be discovered programmatically.# get_delinquency_rate_from_10d("1234567", "0001234567-24-012345")
This programmatic approach ensures that every metric is transparent, auditable, and tied directly to its source filing—the foundation of any robust analytical or risk modeling engine.
Implications for Modeling and AI
This structured, context-rich approach to MBS data fundamentally improves modeling, risk monitoring, and even Large Language Model (LLM) reasoning. When models are built on auditable data pipelines, their outputs become explainable. Instead of a "black box" credit forecast, an analyst can trace a prediction back through the model's inputs to the specific remittance report data that drove the outcome.
This aligns with the core themes of CMD+RVL: creating "model-in-context" frameworks where both the data and the logic are transparent. For LLMs, providing this verified, interconnected data as context—linking a tranche's CUSIP to its deal's 10-D filings, for example—dramatically enhances their ability to reason about complex financial instruments. They can answer questions like, "What was the 60+ day delinquency rate for the Morgan Stanley Capital I Inc. 2011-C3 transaction in Q4 2023?" by querying a graph of verified, linked data points rather than hallucinating from unstructured text. This is the essence of building a reliable "context engine" for finance.
How Dealcharts Accelerates Analysis
Dealcharts connects these disparate datasets—filings, deals, shelves, tranches, and counterparties—into a coherent knowledge graph. This allows analysts to publish and share verified charts and data points without rebuilding complex data pipelines from scratch. For example, instead of writing parsers for every issuer's 10-D format, you can query the Dealcharts API for normalized performance metrics traced back to their source filings, like those from the J.P. Morgan Chase Commercial Mortgage Securities Trust shelf.
Conclusion
The modern definition of mortgage backed securities must extend beyond financial theory to encompass the data and workflows used to analyze them. For quantitative professionals, the value lies not in the concept of securitization itself but in the ability to build explainable, reproducible pipelines that connect raw data to actionable insight. This data-centric approach, grounded in verifiable lineage, is the foundation of the next generation of financial analytics, a framework CMD+RVL is designed to enable.
Article created using Outrank