Explainable AI in Capital Markets
Explainable AI Outcomes in Capital Markets: From Black Box to Verifiable Insight
For professionals in structured finance—whether you're a structured-finance analyst, data engineer, or a quant—the conversation around AI has fundamentally shifted. It's no longer sufficient for a model to be accurate; it must be transparent, auditable, and trustworthy. The era of accepting black-box models for high-stakes decisions is over. Today, explainable AI outcomes in capital markets are a non-negotiable requirement for risk management, regulatory compliance, and driving programmatic analysis. This guide moves beyond theory to demonstrate why this shift is critical, using real-world context from investor reporting and deal monitoring. Platforms like Dealcharts provide the linked, verifiable data necessary to build these trustworthy systems.
The Market Context: Why Explainability is a Mandate, Not a Feature
For years, "explainability" was a concept confined to data science labs. Now, it's a primary concern in boardrooms and on trading floors, driven by intense regulatory and market pressures. In capital markets, deploying AI for credit underwriting in a CMBS deal, automating servicer actions, or assessing counterparty risk with an opaque model is no longer a defensible strategy—it's a significant, unquantified liability. A model whose logic is a mystery creates severe bottlenecks. Model Risk Management (MRM) teams now flag a lack of explainability as a critical failure, stalling model validation, freezing technology budgets, and eroding the trust of portfolio managers who are ultimately accountable.
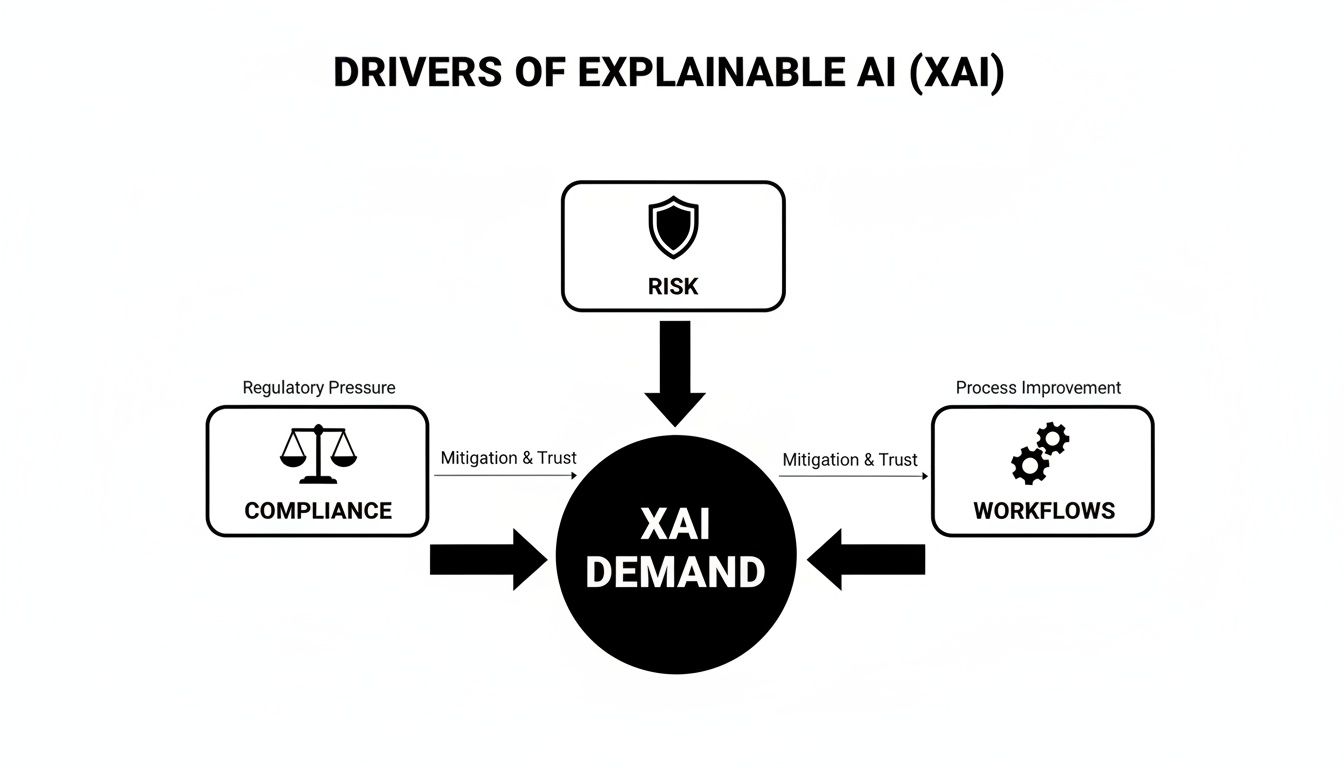
This push for transparency isn't optional. It's a direct response to three primary drivers:
- Regulatory Scrutiny: Regulators globally, through frameworks like the U.S. Federal Reserve's SR 11-7 and the EU's AI Act, demand clear, documented proof of why an automated decision was made.
- Operational Risk Mitigation: Opaque models can fail in unpredictable ways during market volatility, leading to severe financial and reputational damage.
- User Adoption: Analysts, traders, and PMs will not rely on a tool they don't understand. Explainability bridges the gap between a complex algorithm and a tool that enables faster, more confident decisions.
This demand is reflected in enterprise spending. The global Explainable AI market is estimated between USD $7.9–$9.8 billion and is projected to grow significantly. You can explore the full research on this market expansion to see the scale of this shift.

The Data & Technical Angle: Establishing Data Lineage
The foundation of any credible XAI outcome is verifiable data lineage. An explanation is only as trustworthy as the data it is based on. Without a clear, auditable trail from an insight back to its source—whether a 10-D remittance file, a 424B5 prospectus, or a loan-level tape—any explanation lacks the evidence required for high-stakes financial decisions. This "data lineage mindset" asks: Where did this number come from, how was it derived, and how can it be cited?
Analysts and developers can access this source data from public repositories like the SEC's EDGAR database. However, the raw data is often unstructured and disconnected. The key technical challenge is parsing these documents (e.g., XML from 10-D filings) and linking them programmatically. For example, a CUSIP for a specific tranche must be linked to the deal's CIK (Central Index Key), which in turn links to all associated regulatory filings. This linked data structure is what enables true auditability. Datasets available on Dealcharts provide this pre-linked context, connecting filings, deals, shelves, and counterparties.
This process turns abstract model features into concrete, verifiable facts. An LTV ratio is no longer just a number; it's a specific value derived from a named field in a publicly filed document for a known deal.
A Practical Workflow: From Loan Tape to Verifiable Insight
To move from theory to practice, we need a repeatable, auditable workflow. This example demonstrates how to establish explainability for a credit risk model designed to predict default likelihood for loans in an Auto ABS pool, using data sourced from loan-level tapes found in SEC filings.
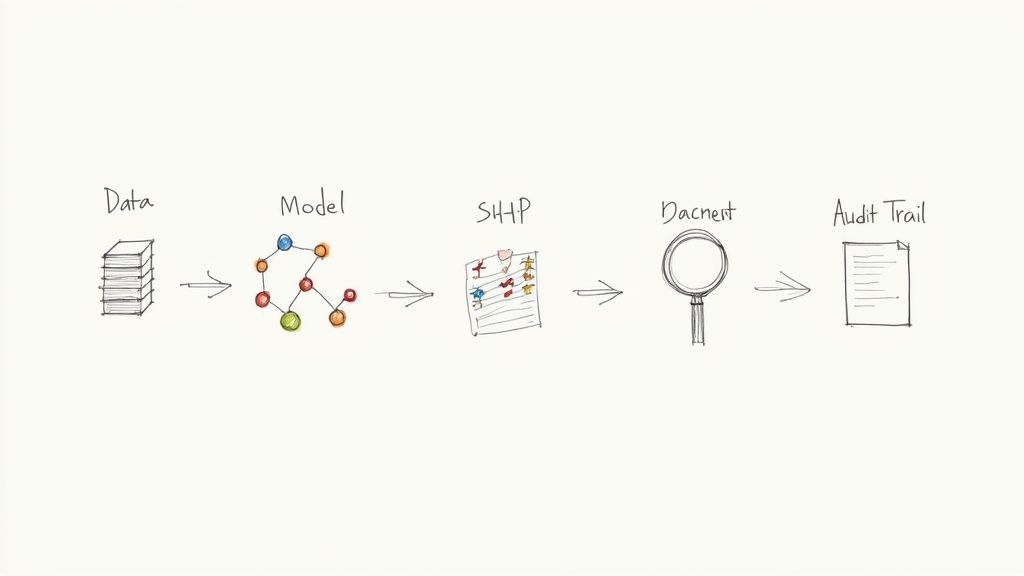
The workflow follows a clear data lineage: Source → Transform → Insight.
- Data Ingestion & Lineage Mapping: Ingest the loan tape. Before training, each column (
,loan_balance
,borrower_fico
) is mapped back to its precise origin in the source filing. This is the bedrock of auditability. You can find examples of such source data by exploring issuers like the JPMorgan Chase & Co. shelf on Dealcharts.vehicle_age - Model Training: Train a performant but complex model, like an XGBoost classifier, to predict
. Its complexity makes it an ideal candidate for XAI analysis.default_probability - Explanation Generation: Use a technique like SHAP (SHapley Additive exPlanations) to compute the contribution of each feature to the model's prediction for every loan.
- Reporting & Verification: For a loan flagged as high-risk, the SHAP analysis might reveal that a low FICO score and high LTV ratio were the primary drivers. Because of the lineage established in step one, these features can be instantly traced back to the source data, closing the audit loop.
A Reproducible Code Example
This Python snippet demonstrates the core of the workflow, applying SHAP to a hypothetical loan dataset derived from a remittance file.
import pandas as pdimport xgboost as xgbimport shap# Step 1: Load and prepare data (assume df is a DataFrame from a loan tape)# This data would be parsed from a source like a 10-D remittance file.data = {'loan_id': ['L001', 'L002', 'L003'],'loan_balance': [50000, 25000, 75000],'borrower_fico': [620, 750, 680],'ltv_ratio': [0.95, 0.70, 0.85],'is_default': [1, 0, 0] # Target variable: 1 for default, 0 for performing}df = pd.DataFrame(data)X = df[['loan_balance', 'borrower_fico', 'ltv_ratio']]y = df['is_default']# Step 2: Train a model# XGBoost is chosen for its performance, but its complexity requires XAI.model = xgb.XGBClassifier(use_label_encoder=False, eval_metric='logloss').fit(X, y)# Step 3: Generate explanations with SHAP# The explainer object provides local and global feature contributions.explainer = shap.Explainer(model)shap_values = explainer(X)# Step 4: Visualize the explanation for the first loan (predicted high-risk)# The waterfall plot shows how each feature pushed the prediction.# Source lineage: 'ltv_ratio' of 0.95 for L001 is traceable to the source filing.print("SHAP explanation for the first loan (high-risk):")shap.plots.waterfall(shap_values[0])
This plot provides a clear, feature-driven rationale that an analyst can act on and an auditor can verify by following the data lineage back to its source, like the BMARK 2024-V5 CMBS deal on Dealcharts.
Implications: Better Models, Risk Monitoring, and LLM Reasoning
Implementing explainable, source-linked AI workflows has profound implications for capital markets. This approach enhances not only traditional risk modeling but also the reasoning capabilities of next-generation tools like Large Language Models (LLMs).
When a model's outputs are tied to verifiable data lineage, it transforms risk monitoring from a reactive to a proactive discipline. Instead of a generic alert, an explainable counterparty risk model can specify why a counterparty's score dropped—for example, citing a 75% spike in exposure to a volatile sector, verified against their latest filings. This allows an analyst to move directly to mitigation instead of wasting time on forensic data gathering. This is the core idea behind "model-in-context" reasoning: the model's output is enriched with the source context needed to validate it.
This structured context is also critical for improving LLM reasoning in finance. An LLM prompted with a question like, "What are the key risks in the 2024 CMBS vintage?" can provide a generic answer based on its training data. However, an LLM grounded in a structured, verifiable dataset—an "explainable pipeline"—can generate a response with cited sources, linking specific risk factors to data points from actual remittance reports and prospectuses.
How Dealcharts Helps
Building these explainable pipelines requires a solid foundation of linked, accessible data. This is where Dealcharts provides critical infrastructure. Dealcharts connects the universe of disconnected datasets—filings, deals, shelves, tranches, and counterparties—into an open, navigable context graph. This allows analysts and developers to publish and share verified charts and build AI models without having to rebuild complex data pipelines from scratch. By providing auditable data lineage out of the box, Dealcharts enables the creation of truly transparent, "model-in-context" financial analytics.
Conclusion: The Future is Verifiable
Achieving meaningful explainable AI outcomes in capital markets is not just a technical challenge; it's a strategic imperative. The ability to produce transparent, auditable, and trustworthy AI systems is essential for navigating regulatory demands and managing risk effectively. This requires a fundamental shift towards a data lineage mindset, where every insight is traceable to a verifiable source. Frameworks that enable this, like the broader CMD+RVL vision, are paving the way for a new generation of reproducible, explainable finance analytics.
Article created using Outrank