Real Estate Data Analytics
How Real Estate Data Analytics Powers Modern Structured Finance
For professionals in structured finance, real estate data analytics has evolved from a niche skill into a core competency. It's the programmatic discipline of transforming raw, disparate data—from SEC filings, servicer reports, and loan-level tapes—into verifiable, model-ready insights. This guide breaks down the data sources, technical workflows, and analytical methods required to monitor asset-backed securities (ABS) and commercial mortgage-backed securities (CMBS) with precision and explainability. The goal is to move beyond static spreadsheets and embrace reproducible analysis, where every output can be traced directly back to its source. Platforms like Dealcharts help visualize and cite this verified data, streamlining the entire surveillance process.
The Market Context: Why Programmatic Analysis is No Longer Optional
The era of relying on gut instinct and manual spreadsheet reviews in real estate finance is over. Analysts face a dual challenge: an explosion of digital data from various property tech sources and increasing market volatility driven by macroeconomic shifts. This environment has created an urgent need for programmatic workflows that can handle fragmented, unstructured data from servicer reports, EDGAR filings, and proprietary systems. Simply extracting and structuring this information is a significant technical hurdle that often paralyzes traditional analysis.
Furthermore, the pressure is intensified by two key trends:
- Digitalization and Proptech: The proliferation of data from IoT sensors, geospatial tools, and property management platforms provides the raw material for sophisticated modeling. However, harnessing this data requires robust data engineering.
- ESG Mandates: Environmental, Social, and Governance (ESG) criteria are now critical for institutional investors. Tracking metrics like carbon footprints or green building compliance requires verifiable data pipelines, transforming ESG from a qualitative check-box to a data-driven requirement.
In a market defined by interest rate volatility and shifting property valuations, a static analysis is obsolete. Modern real estate data analytics provides the tools to stress-test cash flows against rate hikes, dynamically update valuations with real-time market comps, and predict delinquencies by monitoring leading economic indicators. This isn't about gaining a competitive edge; it's about survival. Firms that build explainable, programmatic workflows can identify risks and opportunities while others are still parsing last quarter's reports. For a deeper look at these market shifts, check out this detailed research on the real estate analytics market.
The Data and Technical Angle: Sourcing and Linking Real Estate Data
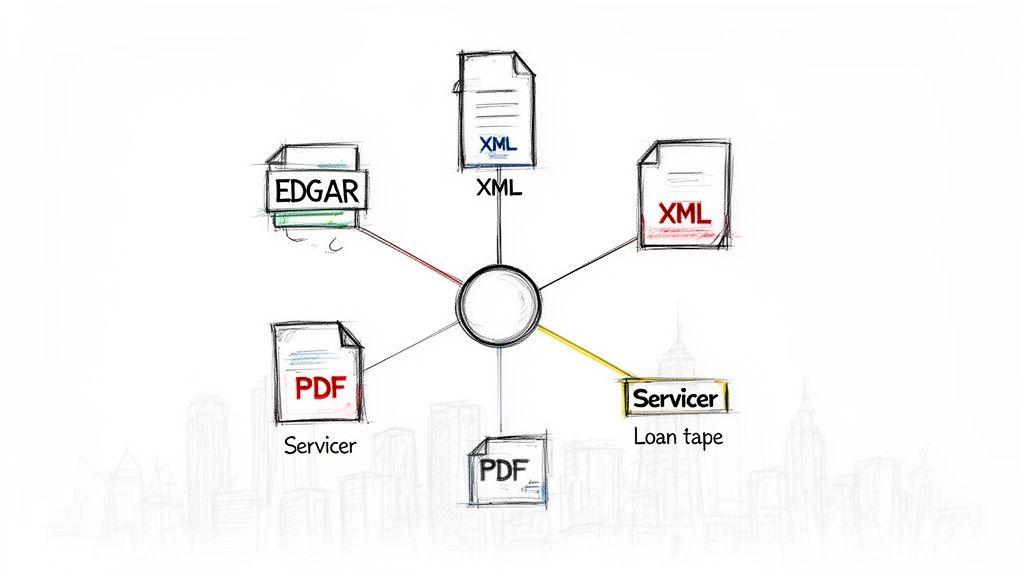
Effective real estate data analytics begins with sourcing, parsing, and linking data from a fragmented landscape of public and private sources. Each document type presents unique challenges, and the ability to programmatically connect them is fundamental to building a verifiable "data lineage"—the traceable path from raw source to final insight.
Publicly Accessible Data (The Source of Truth)
Regulatory filings provide the foundational, publicly verifiable data for any analysis. However, their formats are notoriously inconsistent, demanding significant parsing logic.
- EDGAR Filings (SEC): This is the primary source. Form 10-D filings contain monthly remittance data on loan performance, delinquencies, and cash flows. The Form 424B5 prospectus serves as the deal's blueprint, detailing its structure, tranches, and initial collateral. Access is typically via the EDGAR API.
- Government Records: County-level property records, tax assessments, and deeds offer granular asset details. Accessing this data at scale requires integration with municipal systems or specialized data vendors.
- Economic Data APIs: Sources like the Federal Reserve (FRED) provide essential macroeconomic indicators (e.g., interest rates, unemployment figures) needed for robust performance modeling.
Proprietary and Servicer-Provided Data (The Granular Detail)
This category includes non-public information from servicers, trustees, and third-party vendors, which is critical for deep-dive risk assessment.
- Loan-Level Tapes: These data files (often CSV or XLSX) contain granular attributes for every loan in a securitization pool, from borrower information to property-specific details.
- Servicer Reports: Often delivered as PDFs, these monthly reports provide qualitative commentary and operational updates that supplement the structured data in 10-D filings. They are a prime target for Natural Language Processing (NLP) to extract unstructured risk signals.
The lack of standardization in proprietary data is a major challenge. Building robust parsers is a continuous engineering effort. This is where pre-linked datasets, like the CMBS vintage data available on Dealcharts, can accelerate analysis by providing structured, cross-vintage comparisons without the upfront data wrangling.
Comparing Key Real Estate Data Sources for Structured Finance
This table outlines the primary data sources used in real estate data analytics, detailing their content, typical format, access methods, and relevance for CMBS/ABS analysis.
| Data Source | Primary Content | Common Format | Key Use Case |
|---|---|---|---|
| EDGAR 10-D Filings | Monthly loan performance, delinquencies, servicer advances | XML, XBRL, Text | Surveillance, cash-flow modeling, trigger event monitoring |
| 424B5 Prospectuses | Deal structure, collateral pool stats, tranche details | PDF, HTML | Initial deal analysis, risk retention, covenant review |
| Loan-Level Tapes | Granular loan attributes, borrower info, property types | CSV, Excel (XLSX) | Deep collateral analysis, credit risk modeling |
| Servicer Reports | Operational updates, watchlist commentary, property status | PDF, Word (DOCX) | Qualitative risk assessment, identifying distressed assets |
Example Workflow: Programmatically Calculating Delinquency Rates
A reproducible workflow demonstrates data lineage in action: source → transform → insight. Let's build a simple Python example to calculate the delinquency rate for a CMBS deal directly from an EDGAR 10-D filing. This workflow turns a manual task into an automated, verifiable process.
Step 1: Ingest the 10-D Filing from EDGAR
First, we access the data. Using a deal's Central Index Key (CIK), we can programmatically fetch the latest 10-D filing from the SEC's EDGAR API. This establishes a direct, citable link to our source document.
import requests# Example CIK for a CMBS issuerCIK = "0001541031"headers = {'User-Agent': 'YourName YourEmail@example.com'}# Fetch the latest 10-D filings for the given CIKresponse = requests.get(f"https://data.sec.gov/submissions/CIK{CIK}.json", headers=headers)filings = response.json()# Find the accession number of the most recent 10-D# (Note: Production code would need more robust logic to find the correct remittance file)accession_number = filings['filings']['recent']['accessionNumber'][0].replace('-', '')primary_document = filings['filings']['recent']['primaryDocument'][0]print(f"Accessing 10-D filing: {accession_number}")# In a real workflow, you would now download and parse the primary_document XML.
Step 2: Parse the XML to Extract Loan-Level Data
The downloaded filing is typically in a complex XML format. The core task is to navigate this structure to extract loan-level performance data, specifically the unpaid principal balance (UPB) and delinquency status for each loan. This transforms unstructured text into a structured dataset.
# Pseudocode for parsing the XML file (requires a library like lxml or BeautifulSoup)# from lxml import etree# Assume 'filing_xml_content' holds the downloaded file# root = etree.fromstring(filing_xml_content)# # Define XML namespaces (these vary by filer)# ns = {'ns1': 'http://www.sec.gov/edgar/document/absee/autoloan/assetdata'}# loan_data = []# for loan in root.xpath('//ns1:asset', namespaces=ns):# upb = float(loan.xpath('.//ns1:currentBalanceAmount', namespaces=ns)[0].text)# status = loan.xpath('.//ns1:delinquencyStatus', namespaces=ns)[0].text# loan_data.append({'upb': upb, 'status': status})# print(f"Parsed data for {len(loan_data)} loans.")
Step 3: Calculate the Delinquency Rate
With the data structured, the final step is aggregation. We sum the UPB of all delinquent loans (e.g., 30+ days) and divide by the total UPB of the collateral pool. The resulting metric is now fully traceable to its source filing.
# Pseudocode for calculation# total_upb = sum(loan['upb'] for loan in loan_data)# delinquent_upb = sum(loan['upb'] for loan in loan_data if loan['status'] in ['30-59', '60-89', '90+'])# delinquency_rate = (delinquent_upb / total_upb) * 100 if total_upb > 0 else 0# print(f"Calculated Delinquency Rate: {delinquency_rate:.2f}%")
This simple workflow highlights the power of explainability. The final number isn't just an assumption; it's a verifiable fact derived directly from a public filing. Scaling this process across an entire issuer shelf, like the BMARK CMBS shelf, allows for systematic, cross-deal surveillance.
Insights and Implications: Building the Model-in-Context
The true value of a structured data pipeline is its ability to create a "model-in-context." This means that every model, whether for cash flow projection or risk assessment, is directly linked to its underlying data sources. Instead of relying on static, manually entered inputs, a model-in-context points to the specific filing, report, and line item from which its data was derived. This creates an explainable and dynamic analytical environment.
This approach offers several advantages:
- Improved Model Accuracy: Models fed by live, verifiable data from sources like the BMARK 2024-V9 CMBS deal are inherently more accurate and responsive to market changes.
- Proactive Risk Monitoring: Automated pipelines can monitor deal covenants and performance triggers in near-real-time, flagging potential issues long before they appear in stale quarterly reports.
- Enhanced LLM Reasoning: For financial Large Language Models (LLMs), this structured context is critical. An LLM connected to a verifiable data graph can answer complex questions about deal structures or collateral risk and, crucially, cite its sources. This elevates the LLM from a text generator to a trustworthy analytical tool.
Ultimately, these explainable pipelines build trust. In a market where opacity often masks risk, the ability to demonstrate a clear data lineage is a significant competitive advantage and a core component of modern risk management.
How Dealcharts Helps
Dealcharts connects these disparate datasets—filings, deals, shelves, tranches, and counterparties—so analysts can publish and share verified charts without rebuilding data pipelines. By providing a pre-linked context graph of the structured finance market, the platform accelerates the transition from raw data to verifiable insight. It automates the tedious data plumbing, allowing analysts to focus on what they do best: generating alpha and managing risk with confidence in their data's lineage.
Conclusion: The Future is Explainable and Reproducible
The discipline of real estate data analytics is fundamentally reshaping structured finance. The shift is from qualitative, opaque analysis toward programmatic, verifiable workflows. The demand for insights backed by a clear data lineage is no longer negotiable. By building explainable data pipelines, analysts and data scientists can create reproducible financial models that are more accurate, transparent, and defensible. This is the new standard for precision and trust in credit markets, driven by the broader CMD+RVL framework of building context engines for reproducible finance.