Refinancing Commercial Mortgage
Refinancing Commercial Mortgage: A Programmatic Approach to Risk and Opportunity Analysis
Refinancing a commercial mortgage involves replacing an existing loan with a new one, typically to secure a lower interest rate, different terms, or extract equity. For structured-finance analysts and quants, however, monitoring refinance activity is a critical data problem. It's essential for surveillance of CMBS portfolios, modeling prepayment and default risk, and identifying opportunities within loan pools. This guide focuses on a programmatic framework for analyzing the data signals surrounding a refinancing commercial mortgage event, moving beyond high-level explainers to the technical workflows required for rigorous analysis. The data lineage—from servicer remittance files to actionable insights—is paramount. Tools like Dealcharts help visualize and cite this linked data.
Market Context: The CRE Maturity Wall and Capital Bifurcation
The commercial real estate market is currently defined by the "maturity wall"—a significant volume of loans originated in a low-rate environment now coming due. In the next year alone, an estimated $957 billion in CRE loans will mature, creating immense pressure on borrowers to secure new financing in a much costlier and more selective capital market. This environment, detailed in reports suggesting CRE is hitting a breaking point, has bifurcated the lending landscape.
High-quality assets in favored sectors like industrial and multifamily can still attract capital from life insurance companies and, increasingly, private credit funds. However, office and certain retail properties face a challenging lending environment due to high vacancy rates and lender risk aversion. Regional banks, once a primary source of CRE liquidity, have pulled back, creating a void that alternative lenders are filling, albeit at a higher cost. The CMBS market is showing signs of life, but issuance remains selective. The CMBS vintage for 2024 reflects a cautious but functioning market for well-underwritten properties. This market structure demands a data-driven approach to identify viable refinance candidates and accurately model risk.
Data Sourcing and Linkage for Refinancing Commercial Mortgage Analysis
Effective refinance analysis depends on sourcing and linking disparate datasets to build a complete, verifiable picture of a loan's context. The process starts with loan-level data from CMBS servicer and trustee remittance reports—typically found in SEC EDGAR filings like Form 10-D—and extends to public corporate filings. The goal is to establish a clear data lineage from source to insight.
The foundational data comes from monthly servicer tapes, which contain critical fields for an initial screen: loan maturity dates, current interest rates, and prepayment provisions like lockout periods or defeasance terms. However, the real analytical value lies in the performance metrics. Programmatically extracting the most recent Net Operating Income (NOI) and property valuation allows for the recalculation of current Loan-to-Value (LTV) and Debt Service Coverage Ratio (DSCR). A loan underwritten at a 1.50x DSCR that is now performing at 1.15x is a fundamentally different risk, and this insight is derived directly from servicer-reported data.
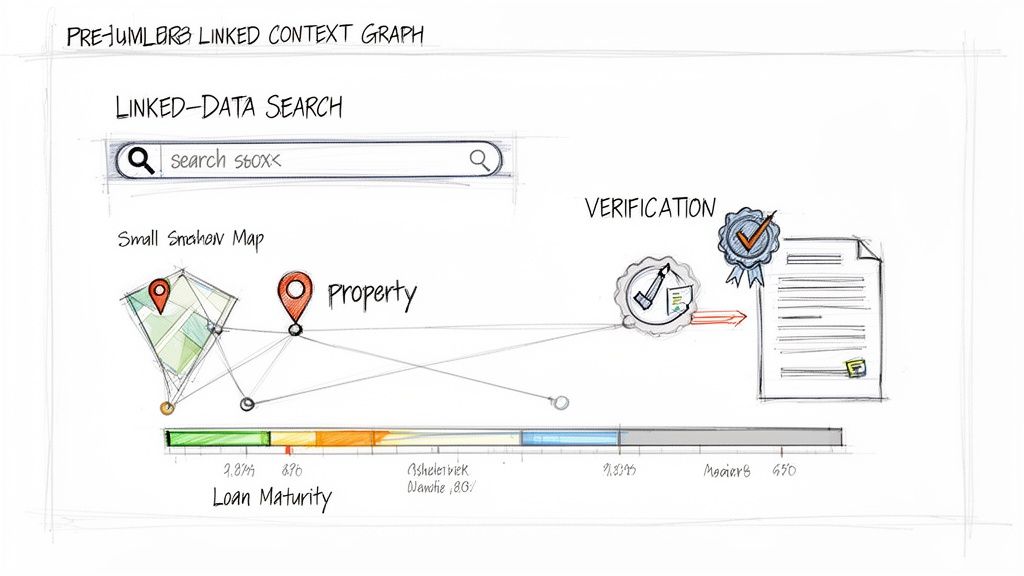
Servicer data alone is insufficient. To understand sponsor health and asset-level context, this loan data must be linked to public filings (10-Ks, 10-Qs) from the ultimate property owner. The challenge is that a loan ID from a CMBS trust does not map directly to a sponsor's CIK. Manually tracing this ownership chain is not scalable. This is a classic linked-data problem solved by building a context graph that programmatically connects deals (e.g., a specific CMBS shelf, like the COMM series), loans, properties, and their corporate parents. This structure enables sophisticated queries, such as identifying all loans backed by properties owned by a single publicly traded REIT that are approaching their maturity dates.
Example Workflow: A Programmatic Refinance Screen
Manual analysis of loan tapes is inefficient and prone to error. A programmatic workflow using a language like Python with the pandas library enables analysts to process vast datasets, apply custom logic, and generate reproducible watchlists. The workflow demonstrates clear data lineage: source data from a servicer CSV is transformed through explicit calculations into an actionable output.
The process begins by ingesting a loan-level file. The first filter typically screens for loans maturing within a specific timeframe (e.g., 18-24 months). The next layer identifies loans with above-market interest rates, making them economically attractive refinance candidates for the borrower.
The critical step is recalculating performance metrics using the latest available data. Relying on at-origination LTV and DSCR is a common failure point. An effective script must derive current metrics from source fields like
andMostRecentNOI
. A loan's LTV may have shifted from 65% at origination to over 80% due to a decline in property value, a transformation that fundamentally alters its risk profile.MostRecentAppraisalValue
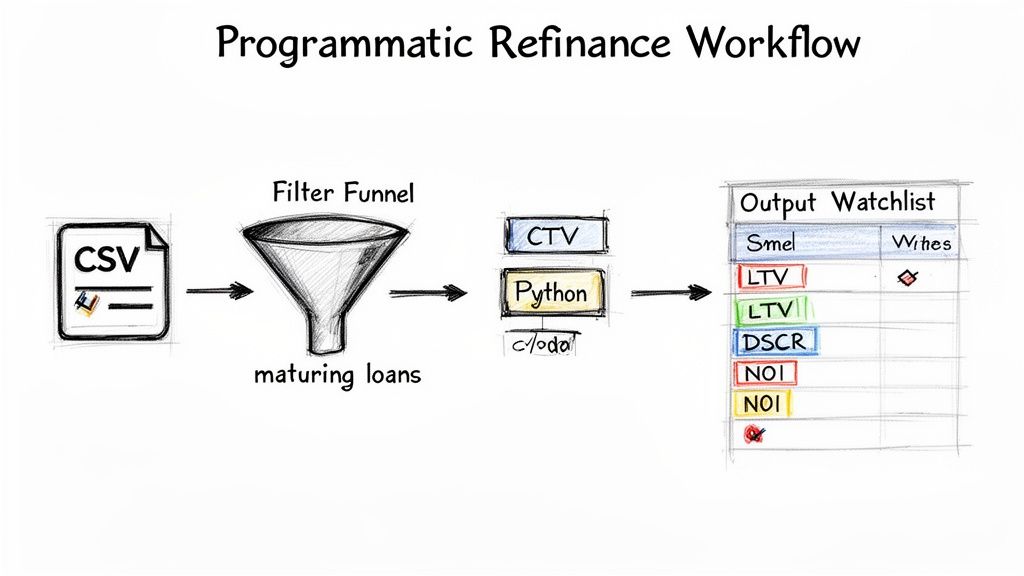
Here is a simplified Python snippet demonstrating this workflow.
import pandas as pdfrom datetime import datetime# Load loan-level data from a servicer report (CSV)# Data Lineage - Source: cmbs_loan_tape.csvdf = pd.read_csv('cmbs_loan_tape.csv')# --- Step 1: Filter for loans nearing maturity (next 24 months) ---df['MaturityDate'] = pd.to_datetime(df['MaturityDate'])cutoff_date = datetime.now() + pd.DateOffset(months=24)candidates = df[df['MaturityDate'] <= cutoff_date].copy()# --- Step 2: Flag loans with above-market interest rates ---current_market_rate = 5.0 # Assumed market ratecandidates['HighRateFlag'] = candidates['InterestRate'] > (current_market_rate + 0.5)# --- Step 3: Recalculate DSCR from most recent financials ---# Data Lineage - Transform: MostRecentNOI / AnnualDebtServicecandidates['CalculatedDSCR'] = candidates['MostRecentNOI'] / candidates['AnnualDebtService']# --- Step 4: Generate a watchlist of strong candidates ---# Criteria: High rate and healthy recalculated DSCR (> 1.25x)watchlist = candidates[(candidates['HighRateFlag'] == True) &(candidates['CalculatedDSCR'] > 1.25)]# --- Output: Actionable watchlist ---print("Refinance Candidate Watchlist:")print(watchlist[['LoanID', 'MaturityDate', 'InterestRate', 'CalculatedDSCR']])
This reproducible script creates a transparent pipeline from raw servicer data to a targeted watchlist. Analysts can cross-reference findings with underlying deal information, such as the collateral detail for BMARK 2024-V9 on Dealcharts, to validate their analysis.
Implications: Building Models-in-Context for Risk and AI
A systematic approach to tracking refinance outcomes generates a proprietary dataset that improves prepayment and default models. Static models that rely on at-origination metrics are brittle. A dynamic "model-in-context" incorporates time-series data and relational context, leading to more accurate risk assessments. For instance, a model can learn that loans managed by a specific servicer have a statistically different modification rate, an insight only available through a linked dataset.
This structured context is critical for explainability. When a model flags a loan as high-risk, an analyst can trace the reasoning through its data lineage: the loan appeared on a servicer watchlist, its primary tenant's credit rating was recently downgraded, and historical data shows a high failure-to-refinance rate for similar assets in that submarket. This moves analysis from black-box prediction to transparent, verifiable reasoning.
These principles align with the CMD+RVL framework, which emphasizes explainable data pipelines. As the industry adopts AI and LLMs, the quality and context of input data become paramount. An LLM querying a context graph can provide far more reliable and citable insights than one parsing unstructured text. A system that can state, "This loan is high-risk because its DSCR fell below 1.1x and its servicer has a 40% foreclosure rate on similar assets," delivers verifiable, actionable intelligence.
How Dealcharts Accelerates Refinance Analysis
Analyzing refinance opportunities requires significant data engineering to connect public filings, deal documents, and servicer reports. Dealcharts provides a pre-built, open context graph that maps the relationships between deals, tranches, loans, properties, and counterparties in the commercial real estate debt market.
This infrastructure allows analysts to bypass the data-wrangling phase and focus directly on analytical questions. Instead of building pipelines, users can immediately query the graph to identify loans maturing in the next year, assess servicer performance patterns, or map a sponsor's obligations across the market. Dealcharts connects these datasets so analysts can publish and share verified charts without rebuilding data pipelines. This accelerates the process of identifying viable refinance candidates, monitoring portfolio risk, and uncovering market trends from a coherent, queryable network of structured finance data.
Conclusion
A programmatic and data-centric approach is essential for navigating the complexities of commercial mortgage refinancing. By establishing clear data lineage from source files to analytical output, analysts can build reproducible workflows that identify risk and opportunity with precision. This structured context not only enhances traditional risk models but also provides the explainable, verifiable foundation required for next-generation AI and quantitative systems. Frameworks like CMD+RVL and platforms like Dealcharts provide the tools to build and leverage these explainable finance analytics.
Article created using Outrank